Clinical Trial Biorepository & Archiving Solutions Market Size, Share | Report 2023-2032
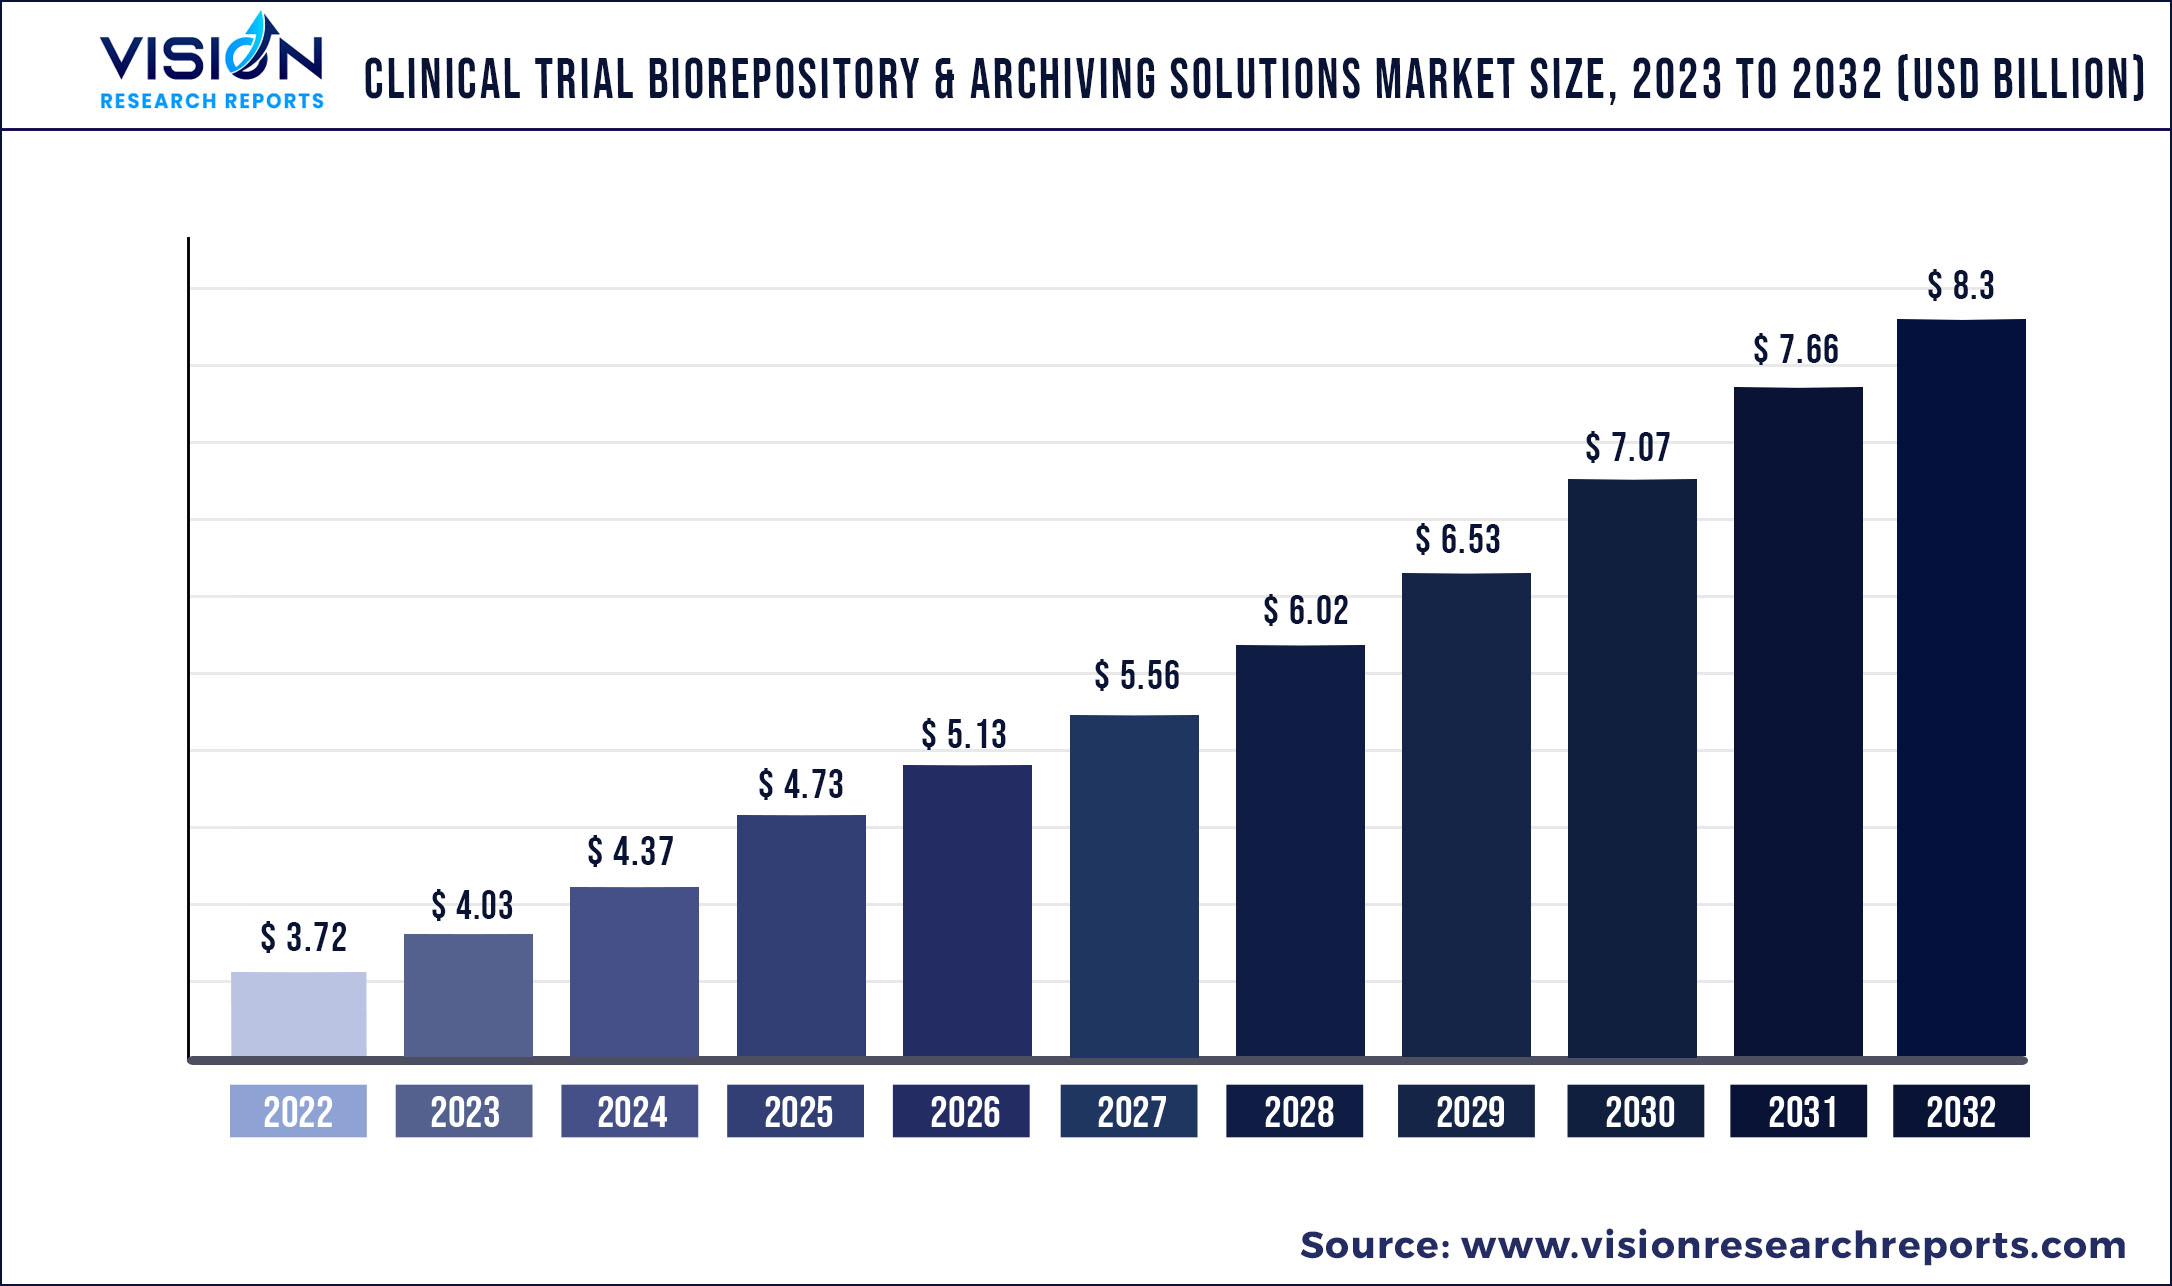
The global clinical trial biorepository & archiving solutions market was valued at USD 3.72 billion in 2022 and it is predicted to surpass around USD 8.3 billion by 2032 with a CAGR of 8.36% from 2023 to 2032.
Key Pointers
Report Scope of the Clinical Trial Biorepository & Archiving Solutions Market
| Report Coverage | Details |
| Market Size in 2022 | USD 3.72 billion |
| Revenue Forecast by 2032 | USD 8.3 billion |
| Growth rate from 2023 to 2032 | CAGR of 8.36% |
| Base Year | 2022 |
| Forecast Period | 2023 to 2032 |
| Market Analysis (Terms Used) | Value (US$ Million/Billion) or (Volume/Units) |
| Regions Covered | North America, Europe, Asia Pacific, Latin America, Middle East & Africa |
| Companies Covered | Azenta U.S., Inc.; Thermo Fisher Scientific Inc. (Patheon); Precision for Medicine, Inc.; Medpace; LabCorp Drug Development; ATCC; Q2 Solutions; Labconnect; Charles River Laboratories; Cell&Co. |
Maintaining pace with the growing storage and transportation technology, global regulatory requirements, and current bio-storage trends can immense cost time and effort.
Smaller pharmaceutical companies avoid the costs of managing cold-chain resources, tracking and monitoring specimen & equipment temperatures, inventory control, equipment management, and other parts of repository quality management by outsourcing specimen storage and cold-chain logistics. The COVID-19 pandemic disrupted the supply chain of clinical trial biorepository and archiving solutions services due to a reduced workforce, travel restrictions, lockdowns in numerous industrial hubs, and changing regulatory rules.
The supply chain interruption also resulted in a lack of clinical trial supplies and delayed delivery of materials to clinical trial sites. These variables also led to the wastage of supplies due to distortions in material quality, further posing industry constraints. However, new models were introduced to ease the market and cope with the changing trend. One of the trends is the implementation of virtual trials and the use of advanced technology, which has been an underpinning technology but is gradually gaining popularity and is expected to witness considerable growth in the coming years.
The industry is anticipated to develop because of the rising prevalence of chronic diseases and the increasing occurrence of new diseases. The disease profiles of people around the world vary, with those in emerging nations having the widest range. Clinical studies for a novel or uncommon diseases, which ordinarily would not have obtained sponsors, are anticipated to benefit from this. An increase in the number of patients with a certain condition would encourage biopharmaceutical companies to increase their investment in clinical trials for that disease segment.
For instance, the U.S. FDA Center for Drug Evaluation and Research approved 50 New Molecular Entities (NMEs) in 2021, of which 28% (14) were biologics; in 2020, it was 53 NMEs, of which 21% (13) were biologics; and in 2019, it was 48 NMEs, of which 21% (10) were biologics. This growing trend of biologics approval will drive the industry. Biobanking is considered a key area to boost growth within these industries due to the availability of translational research and personalized treatment. Biobanks had a significant rise in the number of samples collected for biomarker and companion diagnostic research. The growing interest in biomarkers to understand and identify the biological underpinnings of disease is driving this trend.
Key Companies & Market Share Insights
Industry participants are undertaking various strategic initiatives, such as the signing of new partnership agreements, collaborations, mergers & acquisitions, and geographic expansions, to strengthen their services and gain a competitive advantage over other players. For instance, in October 2021, Azenta Life Sciences and Cleveland Clinic announced the opening of a new 22,000-square-foot biospecimen sample management and repository facility on Cleveland Clinic’s main campus. The new facility will help the Cleveland Clinic expand its biobanking capabilities and hasten translational research. Some prominent players in the global clinical trial biorepository & archiving solutions market are:
Clinical Trial Biorepository & Archiving Solutions Market Segmentations:
By Service
By Product
By Phase
Chapter 1. Introduction
1.1. Research Objective
1.2. Scope of the Study
1.3. Definition
Chapter 2. Research Methodology
2.1. Research Approach
2.2. Data Sources
2.3. Assumptions & Limitations
Chapter 3. Executive Summary
3.1. Market Snapshot
Chapter 4. Market Variables and Scope
4.1. Introduction
4.2. Market Classification and Scope
4.3. Industry Value Chain Analysis
4.3.1. Raw Material Procurement Analysis
4.3.2. Sales and Distribution Service Analysis
4.3.3. Downstream Buyer Analysis
Chapter 5. COVID 19 Impact on Clinical Trial Biorepository & Archiving Solutions Market
5.1. COVID-19 Landscape: Clinical Trial Biorepository & Archiving Solutions Industry Impact
5.2. COVID 19 - Impact Assessment for the Industry
5.3. COVID 19 Impact: Global Major Government Policy
5.4. Market Trends and Opportunities in the COVID-19 Landscape
Chapter 6. Market Dynamics Analysis and Trends
6.1. Market Dynamics
6.1.1. Market Drivers
6.1.2. Market Restraints
6.1.3. Market Opportunities
6.2. Porter’s Five Forces Analysis
6.2.1. Bargaining power of suppliers
6.2.2. Bargaining power of buyers
6.2.3. Threat of substitute
6.2.4. Threat of new entrants
6.2.5. Degree of competition
Chapter 7. Competitive Landscape
7.1.1. Company Market Share/Positioning Analysis
7.1.2. Key Strategies Adopted by Players
7.1.3. Vendor Landscape
7.1.3.1. List of Suppliers
7.1.3.2. List of Buyers
Chapter 8. Global Clinical Trial Biorepository & Archiving Solutions Market, By Service
8.1. Clinical Trial Biorepository & Archiving Solutions Market, by Service, 2023-2032
8.1.1 Biorepository Services
8.1.1.1. Market Revenue and Forecast (2020-2032)
8.1.2. Archiving Solution Services
8.1.2.1. Market Revenue and Forecast (2020-2032)
Chapter 9. Global Clinical Trial Biorepository & Archiving Solutions Market, By Product
9.1. Clinical Trial Biorepository & Archiving Solutions Market, by Product, 2023-2032
9.1.1. Preclinical Products
9.1.1.1. Market Revenue and Forecast (2020-2032)
9.1.2. Clinical Products
9.1.2.1. Market Revenue and Forecast (2020-2032)
Chapter 10. Global Clinical Trial Biorepository & Archiving Solutions Market, By Phase
10.1. Clinical Trial Biorepository & Archiving Solutions Market, by Phase, 2023-2032
10.1.1. Phase I
10.1.1.1. Market Revenue and Forecast (2020-2032)
10.1.2. Phase II
10.1.2.1. Market Revenue and Forecast (2020-2032)
10.1.3. Phase III
10.1.3.1. Market Revenue and Forecast (2020-2032)
10.1.4. Phase IV
10.1.4.1. Market Revenue and Forecast (2020-2032)
Chapter 11. Global Clinical Trial Biorepository & Archiving Solutions Market, Regional Estimates and Trend Forecast
11.1. North America
11.1.1. Market Revenue and Forecast, by Service (2020-2032)
11.1.2. Market Revenue and Forecast, by Product (2020-2032)
11.1.3. Market Revenue and Forecast, by Phase (2020-2032)
11.1.4. U.S.
11.1.4.1. Market Revenue and Forecast, by Service (2020-2032)
11.1.4.2. Market Revenue and Forecast, by Product (2020-2032)
11.1.4.3. Market Revenue and Forecast, by Phase (2020-2032)
11.1.5. Rest of North America
11.1.5.1. Market Revenue and Forecast, by Service (2020-2032)
11.1.5.2. Market Revenue and Forecast, by Product (2020-2032)
11.1.5.3. Market Revenue and Forecast, by Phase (2020-2032)
11.2. Europe
11.2.1. Market Revenue and Forecast, by Service (2020-2032)
11.2.2. Market Revenue and Forecast, by Product (2020-2032)
11.2.3. Market Revenue and Forecast, by Phase (2020-2032)
11.2.4. UK
11.2.4.1. Market Revenue and Forecast, by Service (2020-2032)
11.2.4.2. Market Revenue and Forecast, by Product (2020-2032)
11.2.4.3. Market Revenue and Forecast, by Phase (2020-2032)
11.2.5. Germany
11.2.5.1. Market Revenue and Forecast, by Service (2020-2032)
11.2.5.2. Market Revenue and Forecast, by Product (2020-2032)
11.2.5.3. Market Revenue and Forecast, by Phase (2020-2032)
11.2.6. France
11.2.6.1. Market Revenue and Forecast, by Service (2020-2032)
11.2.6.2. Market Revenue and Forecast, by Product (2020-2032)
11.2.6.3. Market Revenue and Forecast, by Phase (2020-2032)
11.2.7. Rest of Europe
11.2.7.1. Market Revenue and Forecast, by Service (2020-2032)
11.2.7.2. Market Revenue and Forecast, by Product (2020-2032)
11.2.7.3. Market Revenue and Forecast, by Phase (2020-2032)
11.3. APAC
11.3.1. Market Revenue and Forecast, by Service (2020-2032)
11.3.2. Market Revenue and Forecast, by Product (2020-2032)
11.3.3. Market Revenue and Forecast, by Phase (2020-2032)
11.3.4. India
11.3.4.1. Market Revenue and Forecast, by Service (2020-2032)
11.3.4.2. Market Revenue and Forecast, by Product (2020-2032)
11.3.4.3. Market Revenue and Forecast, by Phase (2020-2032)
11.3.5. China
11.3.5.1. Market Revenue and Forecast, by Service (2020-2032)
11.3.5.2. Market Revenue and Forecast, by Product (2020-2032)
11.3.5.3. Market Revenue and Forecast, by Phase (2020-2032)
11.3.6. Japan
11.3.6.1. Market Revenue and Forecast, by Service (2020-2032)
11.3.6.2. Market Revenue and Forecast, by Product (2020-2032)
11.3.6.3. Market Revenue and Forecast, by Phase (2020-2032)
11.3.7. Rest of APAC
11.3.7.1. Market Revenue and Forecast, by Service (2020-2032)
11.3.7.2. Market Revenue and Forecast, by Product (2020-2032)
11.3.7.3. Market Revenue and Forecast, by Phase (2020-2032)
11.4. MEA
11.4.1. Market Revenue and Forecast, by Service (2020-2032)
11.4.2. Market Revenue and Forecast, by Product (2020-2032)
11.4.3. Market Revenue and Forecast, by Phase (2020-2032)
11.4.4. GCC
11.4.4.1. Market Revenue and Forecast, by Service (2020-2032)
11.4.4.2. Market Revenue and Forecast, by Product (2020-2032)
11.4.4.3. Market Revenue and Forecast, by Phase (2020-2032)
11.4.5. North Africa
11.4.5.1. Market Revenue and Forecast, by Service (2020-2032)
11.4.5.2. Market Revenue and Forecast, by Product (2020-2032)
11.4.5.3. Market Revenue and Forecast, by Phase (2020-2032)
11.4.6. South Africa
11.4.6.1. Market Revenue and Forecast, by Service (2020-2032)
11.4.6.2. Market Revenue and Forecast, by Product (2020-2032)
11.4.6.3. Market Revenue and Forecast, by Phase (2020-2032)
11.4.7. Rest of MEA
11.4.7.1. Market Revenue and Forecast, by Service (2020-2032)
11.4.7.2. Market Revenue and Forecast, by Product (2020-2032)
11.4.7.3. Market Revenue and Forecast, by Phase (2020-2032)
11.5. Latin America
11.5.1. Market Revenue and Forecast, by Service (2020-2032)
11.5.2. Market Revenue and Forecast, by Product (2020-2032)
11.5.3. Market Revenue and Forecast, by Phase (2020-2032)
11.5.4. Brazil
11.5.4.1. Market Revenue and Forecast, by Service (2020-2032)
11.5.4.2. Market Revenue and Forecast, by Product (2020-2032)
11.5.4.3. Market Revenue and Forecast, by Phase (2020-2032)
11.5.5. Rest of LATAM
11.5.5.1. Market Revenue and Forecast, by Service (2020-2032)
11.5.5.2. Market Revenue and Forecast, by Product (2020-2032)
11.5.5.3. Market Revenue and Forecast, by Phase (2020-2032)
Chapter 12. Company Profiles
12.1. Azenta U.S., Inc.
12.1.1. Company Overview
12.1.2. Product Offerings
12.1.3. Financial Performance
12.1.4. Recent Initiatives
12.2. Thermo Fisher Scientific Inc. (Patheon)
12.2.1. Company Overview
12.2.2. Product Offerings
12.2.3. Financial Performance
12.2.4. Recent Initiatives
12.3. Precision for Medicine, Inc.
12.3.1. Company Overview
12.3.2. Product Offerings
12.3.3. Financial Performance
12.3.4. Recent Initiatives
12.4. Medpace
12.4.1. Company Overview
12.4.2. Product Offerings
12.4.3. Financial Performance
12.4.4. Recent Initiatives
12.5. LabCorp Drug Development
12.5.1. Company Overview
12.5.2. Product Offerings
12.5.3. Financial Performance
12.5.4. Recent Initiatives
12.6. ATCC
12.6.1. Company Overview
12.6.2. Product Offerings
12.6.3. Financial Performance
12.6.4. Recent Initiatives
12.7. Q2 Solutions
12.7.1. Company Overview
12.7.2. Product Offerings
12.7.3. Financial Performance
12.7.4. Recent Initiatives
12.8. Labconnect
12.8.1. Company Overview
12.8.2. Product Offerings
12.8.3. Financial Performance
12.8.4. Recent Initiatives
12.9. Charles River Laboratories
12.9.1. Company Overview
12.9.2. Product Offerings
12.9.3. Financial Performance
12.9.4. Recent Initiatives
12.10. Cell&Co
12.10.1. Company Overview
12.10.2. Product Offerings
12.10.3. Financial Performance
12.10.4. Recent Initiatives
Chapter 13. Research Methodology
13.1. Primary Research
13.2. Secondary Research
13.3. Assumptions
Chapter 14. Appendix
14.1. About Us
14.2. Glossary of Terms
 Cross-segment Market Size and Analysis for
Mentioned Segments
Additional Company Profiles (Upto 5 With No Cost)
Additional Countries (Apart From Mentioned Countries)
Country/Region-specific Report
Go To Market Strategy
Region Specific Market DynamicsRegion Level Market Share Import Export AnalysisProduction AnalysisOthers
Cross-segment Market Size and Analysis for
Mentioned Segments
Additional Company Profiles (Upto 5 With No Cost)
Additional Countries (Apart From Mentioned Countries)
Country/Region-specific Report
Go To Market Strategy
Region Specific Market DynamicsRegion Level Market Share Import Export AnalysisProduction AnalysisOthers