Clinical Trials Support Services Market Size, Share | Report 2023-2032
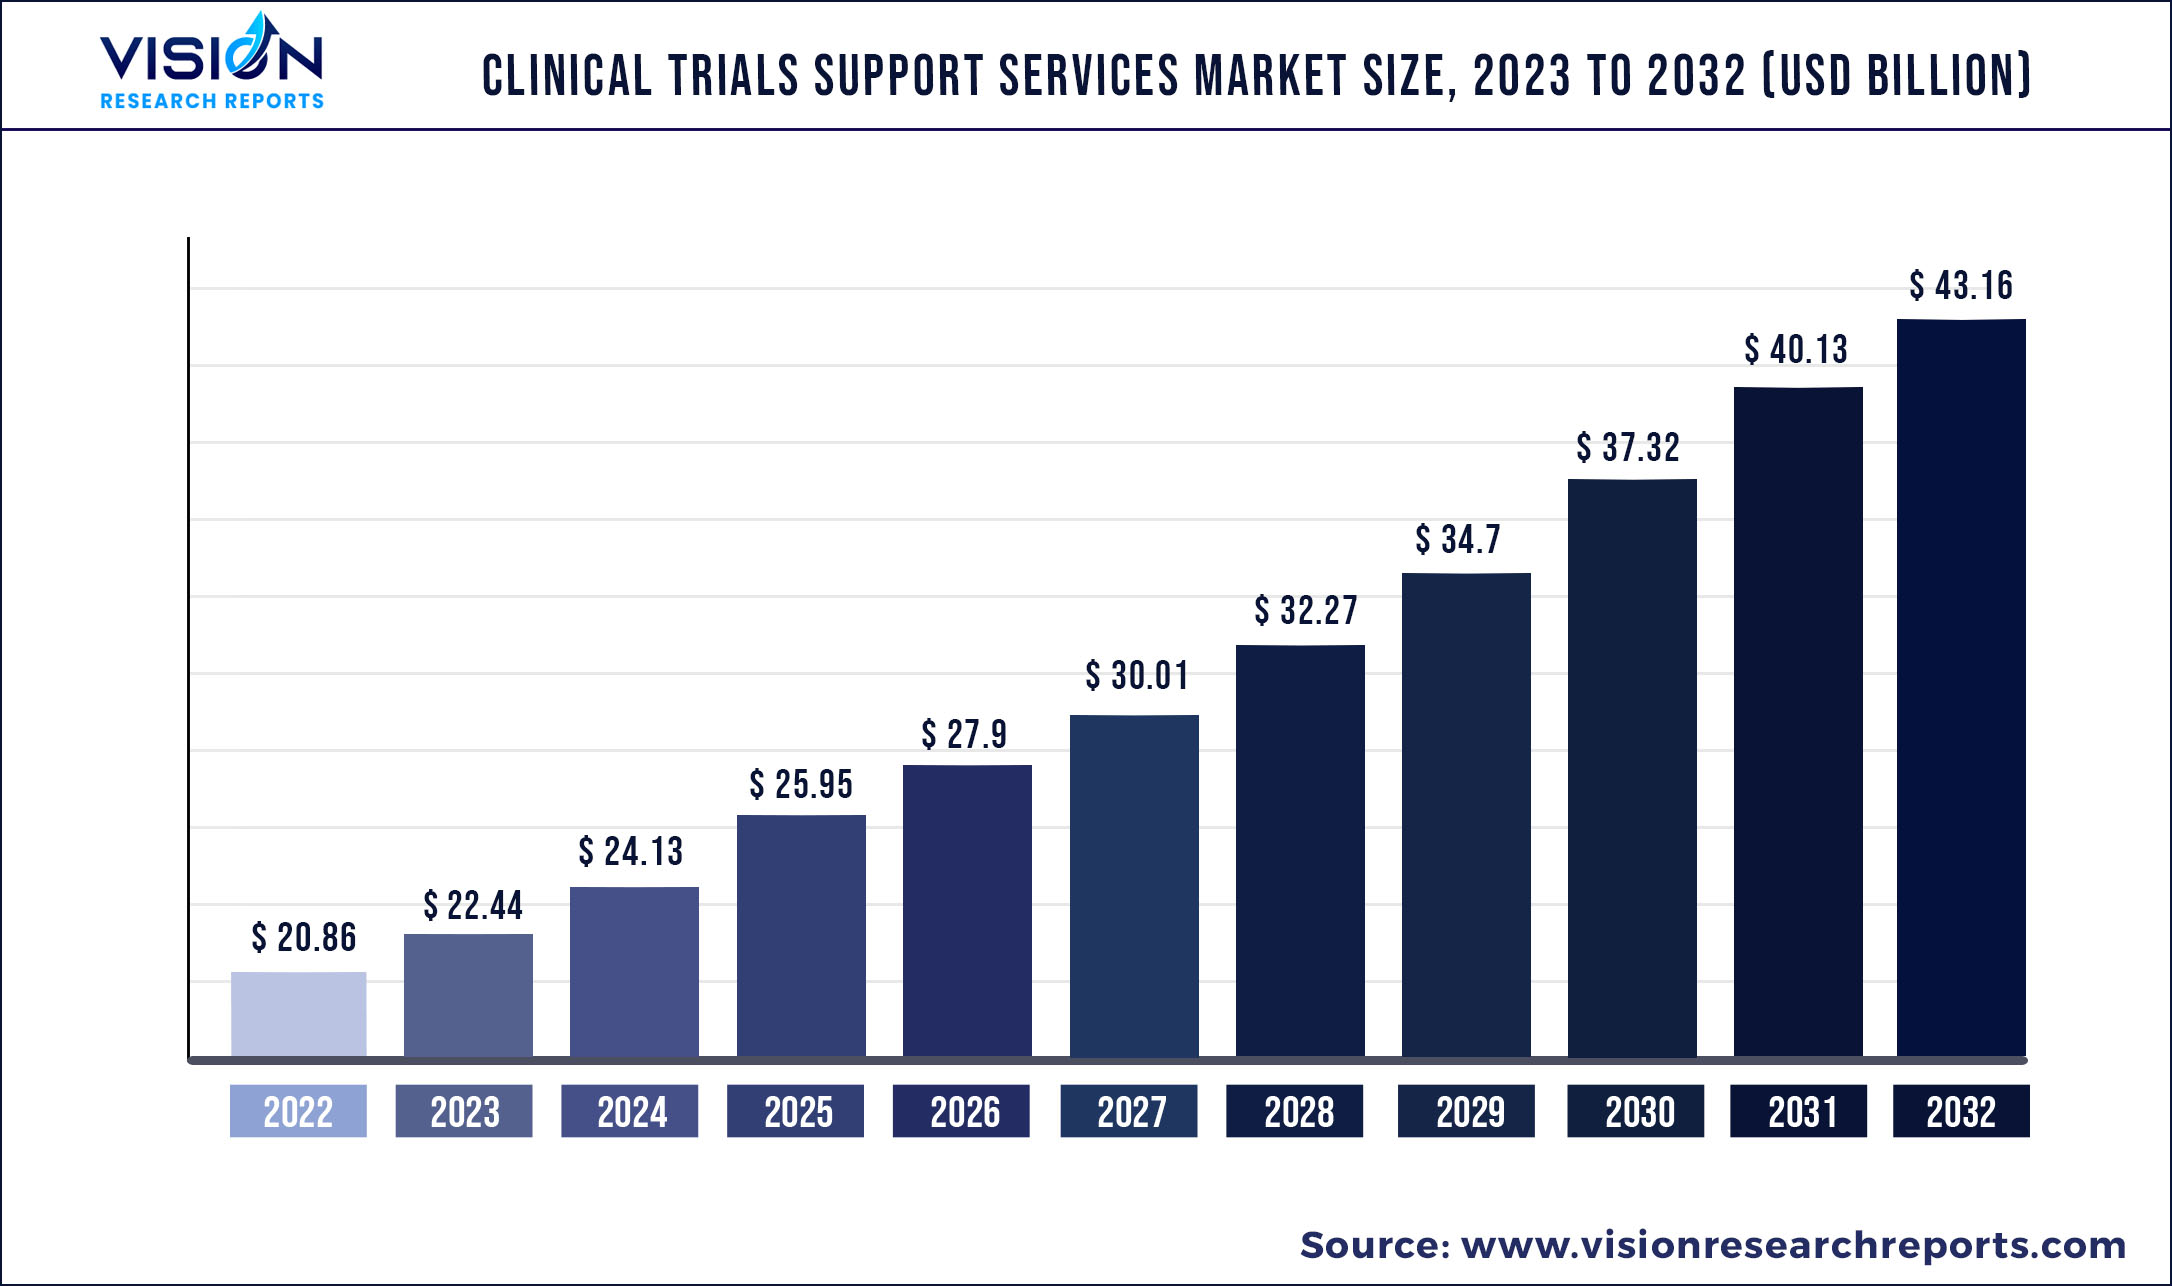
The global clinical trials support services market size was estimated at around USD 20.86 billion in 2022 and it is projected to hit around USD 43.16 billion by 2032, growing at a CAGR of 7.54% from 2023 to 2032.
Key Pointers
Report Scope of the Clinical Trials Support Services Market
| Report Coverage | Details |
| Market Size in 2022 | USD 20.86 billion |
| Revenue Forecast by 2032 | USD 43.16 billion |
| Growth rate from 2023 to 2032 | CAGR of 7.54% |
| Base Year | 2022 |
| Forecast Period | 2023 to 2032 |
| Market Analysis (Terms Used) | Value (US$ Million/Billion) or (Volume/Units) |
| Regions Covered | North America, Europe, Asia Pacific, Latin America, Middle East & Africa |
| Companies Covered | Charles River Laboratories Inc.; Eurofins Scientific SE; IQVIA; Syneos Health Inc.; The Pharmaceutical Product Development LLC; Icon PLC; WuXi AppTec; LabCorp; Alcura; Parexel International. |
The global market is projected to expand rapidly due to the rising demand for trials in emerging economies, rising R&D investment, and an increasing number of contract research organizations (CROs). The pharmaceutical firms’ (R&D) venture has been steadily increasing every year, largely due to patent expirations. An ordinary patent terminates after 20 years; in the pharmaceutical area, there is an arrangement that provides for the entry of a generic version of the medication into the market following a time of 10 years. Thus, firms are boosting their R&D interests to speed the advancement of drugs, subsequently extending the whole market.
Clinical trials support services are quite useful in the event of a drug, assay design, and clinical testing. It also covers tasks such as strengthening clinical test locations, securing and storing research medicines, drug dosage calculation, and kit handling. Preclinical groundwork and research are provided by clinical test support services, which include clinical test site assistance, obtaining and storing study drugs, blinding of study drugs, patient recruiting, coordination, and reconciliation of returned medications.
The clinical trial sector underwent significant changes in 2021. With the introduction of COVID-19 vaccines, numerous clinical trials that had been halted due to the pandemic were re-initiated. In the first quarter of 2021, around 44% more clinical trials commenced compared to the first quarter of 2020. Although in-person clinical trials were once again viable, adoption of new technologies remained high, with 74% of sponsors adopting remote monitoring and 77% of sites using eRegulatory software.
Many software tools for data management are referred to as “Clinical Data Management” (CDM) systems. Multicentric trials require CDM systems to handle massive volumes of data. The majority of CDM systems utilized by pharmaceutical companies are commercial, but there are a few free-source tools accessible as well. Oracle Clinical, Clintrial, Oracle Clinical, Macro, RAVE, and eClinical Suite are common CDM tools. Maintaining an audit record of data management actions is important in regulatory submission studies. These CDM tools help ensure the audit trail and manage discrepancies. The CDM activities include data collection, CRF tracking, CRF annotation, database design, data entry, medical coding, data validation, discrepancy management, and database lock.
Regional Insights
North America dominated the global market in 2022 with the largest share of 50.45%, as most of the pharmaceutical businesses located in the U.S. perform a majority of their business in this region. This market is likely to grow due to the high number of clinical trials being conducted in the region. Major R&D investments and government support for clinical trials are further promoting market growth. The presence of key CROs offering clinical trial support services and multinational pharmaceutical & biopharmaceutical companies making major investments in clinical research has contributed to market growth in North America.
Asia Pacific is anticipated to be the fastest-growing regional market during the forecast period. Factors driving the APAC market include a developing patient population, simplicity of administrative compliance, minimal expense of conducting studies, and the presence of a couple of top clinical organizations acting at sites.
Clinical Trials Support Services Market Segmentations:
By Service
By Phase
By Sponsor
Chapter 1. Introduction
1.1. Research Objective
1.2. Scope of the Study
1.3. Definition
Chapter 2. Research Methodology
2.1. Research Approach
2.2. Data Sources
2.3. Assumptions & Limitations
Chapter 3. Executive Summary
3.1. Market Snapshot
Chapter 4. Market Variables and Scope
4.1. Introduction
4.2. Market Classification and Scope
4.3. Industry Value Chain Analysis
4.3.1. Raw Material Procurement Analysis
4.3.2. Sales and Distribution Service Analysis
4.3.3. Downstream Buyer Analysis
Chapter 5. COVID 19 Impact on Clinical Trials Support Services Market
5.1. COVID-19 Landscape: Clinical Trials Support Services Industry Impact
5.2. COVID 19 - Impact Assessment for the Industry
5.3. COVID 19 Impact: Global Major Government Policy
5.4. Market Trends and Opportunities in the COVID-19 Landscape
Chapter 6. Market Dynamics Analysis and Trends
6.1. Market Dynamics
6.1.1. Market Drivers
6.1.2. Market Restraints
6.1.3. Market Opportunities
6.2. Porter’s Five Forces Analysis
6.2.1. Bargaining power of suppliers
6.2.2. Bargaining power of buyers
6.2.3. Threat of substitute
6.2.4. Threat of new entrants
6.2.5. Degree of competition
Chapter 7. Competitive Landscape
7.1.1. Company Market Share/Positioning Analysis
7.1.2. Key Strategies Adopted by Players
7.1.3. Vendor Landscape
7.1.3.1. List of Suppliers
7.1.3.2. List of Buyers
Chapter 8. Global Clinical Trials Support Services Market, By Service
8.1. Clinical Trials Support Services Market, by Service, 2023-2032
8.1.1 Clinical Trial Site Management
8.1.1.1. Market Revenue and Forecast (2020-2032)
8.1.2. Patient Recruitment Management
8.1.2.1. Market Revenue and Forecast (2020-2032)
8.1.3. Data Management
8.1.3.1. Market Revenue and Forecast (2020-2032)
8.1.4. Administrative staff
8.1.4.1. Market Revenue and Forecast (2020-2032)
8.1.5. IRB
8.1.5.1. Market Revenue and Forecast (2020-2032)
8.1.6. Others
8.1.6.1. Market Revenue and Forecast (2020-2032)
Chapter 9. Global Clinical Trials Support Services Market, By Phase
9.1. Clinical Trials Support Services Market, by Phase, 2023-2032
9.1.1. Phase I
9.1.1.1. Market Revenue and Forecast (2020-2032)
9.1.2. Phase II
9.1.2.1. Market Revenue and Forecast (2020-2032)
9.1.3. Phase III
9.1.3.1. Market Revenue and Forecast (2020-2032)
9.1.4. Phase IV
9.1.4.1. Market Revenue and Forecast (2020-2032)
Chapter 10. Global Clinical Trials Support Services Market, By Sponsor
10.1. Clinical Trials Support Services Market, by Sponsor, 2023-2032
10.1.1. Pharmaceutical & Biopharmaceutical
10.1.1.1. Market Revenue and Forecast (2020-2032)
10.1.2. Medical Devices
10.1.2.1. Market Revenue and Forecast (2020-2032)
10.1.3. Others
10.1.3.1. Market Revenue and Forecast (2020-2032)
Chapter 11. Global Clinical Trials Support Services Market, Regional Estimates and Trend Forecast
11.1. North America
11.1.1. Market Revenue and Forecast, by Service (2020-2032)
11.1.2. Market Revenue and Forecast, by Phase (2020-2032)
11.1.3. Market Revenue and Forecast, by Sponsor (2020-2032)
11.1.4. U.S.
11.1.4.1. Market Revenue and Forecast, by Service (2020-2032)
11.1.4.2. Market Revenue and Forecast, by Phase (2020-2032)
11.1.4.3. Market Revenue and Forecast, by Sponsor (2020-2032)
11.1.5. Rest of North America
11.1.5.1. Market Revenue and Forecast, by Service (2020-2032)
11.1.5.2. Market Revenue and Forecast, by Phase (2020-2032)
11.1.5.3. Market Revenue and Forecast, by Sponsor (2020-2032)
11.2. Europe
11.2.1. Market Revenue and Forecast, by Service (2020-2032)
11.2.2. Market Revenue and Forecast, by Phase (2020-2032)
11.2.3. Market Revenue and Forecast, by Sponsor (2020-2032)
11.2.4. UK
11.2.4.1. Market Revenue and Forecast, by Service (2020-2032)
11.2.4.2. Market Revenue and Forecast, by Phase (2020-2032)
11.2.4.3. Market Revenue and Forecast, by Sponsor (2020-2032)
11.2.5. Germany
11.2.5.1. Market Revenue and Forecast, by Service (2020-2032)
11.2.5.2. Market Revenue and Forecast, by Phase (2020-2032)
11.2.5.3. Market Revenue and Forecast, by Sponsor (2020-2032)
11.2.6. France
11.2.6.1. Market Revenue and Forecast, by Service (2020-2032)
11.2.6.2. Market Revenue and Forecast, by Phase (2020-2032)
11.2.6.3. Market Revenue and Forecast, by Sponsor (2020-2032)
11.2.7. Rest of Europe
11.2.7.1. Market Revenue and Forecast, by Service (2020-2032)
11.2.7.2. Market Revenue and Forecast, by Phase (2020-2032)
11.2.7.3. Market Revenue and Forecast, by Sponsor (2020-2032)
11.3. APAC
11.3.1. Market Revenue and Forecast, by Service (2020-2032)
11.3.2. Market Revenue and Forecast, by Phase (2020-2032)
11.3.3. Market Revenue and Forecast, by Sponsor (2020-2032)
11.3.4. India
11.3.4.1. Market Revenue and Forecast, by Service (2020-2032)
11.3.4.2. Market Revenue and Forecast, by Phase (2020-2032)
11.3.4.3. Market Revenue and Forecast, by Sponsor (2020-2032)
11.3.5. China
11.3.5.1. Market Revenue and Forecast, by Service (2020-2032)
11.3.5.2. Market Revenue and Forecast, by Phase (2020-2032)
11.3.5.3. Market Revenue and Forecast, by Sponsor (2020-2032)
11.3.6. Japan
11.3.6.1. Market Revenue and Forecast, by Service (2020-2032)
11.3.6.2. Market Revenue and Forecast, by Phase (2020-2032)
11.3.6.3. Market Revenue and Forecast, by Sponsor (2020-2032)
11.3.7. Rest of APAC
11.3.7.1. Market Revenue and Forecast, by Service (2020-2032)
11.3.7.2. Market Revenue and Forecast, by Phase (2020-2032)
11.3.7.3. Market Revenue and Forecast, by Sponsor (2020-2032)
11.4. MEA
11.4.1. Market Revenue and Forecast, by Service (2020-2032)
11.4.2. Market Revenue and Forecast, by Phase (2020-2032)
11.4.3. Market Revenue and Forecast, by Sponsor (2020-2032)
11.4.4. GCC
11.4.4.1. Market Revenue and Forecast, by Service (2020-2032)
11.4.4.2. Market Revenue and Forecast, by Phase (2020-2032)
11.4.4.3. Market Revenue and Forecast, by Sponsor (2020-2032)
11.4.5. North Africa
11.4.5.1. Market Revenue and Forecast, by Service (2020-2032)
11.4.5.2. Market Revenue and Forecast, by Phase (2020-2032)
11.4.5.3. Market Revenue and Forecast, by Sponsor (2020-2032)
11.4.6. South Africa
11.4.6.1. Market Revenue and Forecast, by Service (2020-2032)
11.4.6.2. Market Revenue and Forecast, by Phase (2020-2032)
11.4.6.3. Market Revenue and Forecast, by Sponsor (2020-2032)
11.4.7. Rest of MEA
11.4.7.1. Market Revenue and Forecast, by Service (2020-2032)
11.4.7.2. Market Revenue and Forecast, by Phase (2020-2032)
11.4.7.3. Market Revenue and Forecast, by Sponsor (2020-2032)
11.5. Latin America
11.5.1. Market Revenue and Forecast, by Service (2020-2032)
11.5.2. Market Revenue and Forecast, by Phase (2020-2032)
11.5.3. Market Revenue and Forecast, by Sponsor (2020-2032)
11.5.4. Brazil
11.5.4.1. Market Revenue and Forecast, by Service (2020-2032)
11.5.4.2. Market Revenue and Forecast, by Phase (2020-2032)
11.5.4.3. Market Revenue and Forecast, by Sponsor (2020-2032)
11.5.5. Rest of LATAM
11.5.5.1. Market Revenue and Forecast, by Service (2020-2032)
11.5.5.2. Market Revenue and Forecast, by Phase (2020-2032)
11.5.5.3. Market Revenue and Forecast, by Sponsor (2020-2032)
Chapter 12. Company Profiles
12.1. Charles River Laboratories Inc.
12.1.1. Company Overview
12.1.2. Product Offerings
12.1.3. Financial Performance
12.1.4. Recent Initiatives
12.2. Eurofins Scientific SE
12.2.1. Company Overview
12.2.2. Product Offerings
12.2.3. Financial Performance
12.2.4. Recent Initiatives
12.3. IQVIA
12.3.1. Company Overview
12.3.2. Product Offerings
12.3.3. Financial Performance
12.3.4. Recent Initiatives
12.4. Syneos Health Inc.
12.4.1. Company Overview
12.4.2. Product Offerings
12.4.3. Financial Performance
12.4.4. Recent Initiatives
12.5. The Pharmaceutical Product Development LLC
12.5.1. Company Overview
12.5.2. Product Offerings
12.5.3. Financial Performance
12.5.4. Recent Initiatives
12.6. Icon PLC
12.6.1. Company Overview
12.6.2. Product Offerings
12.6.3. Financial Performance
12.6.4. Recent Initiatives
12.7. WuXi AppTec
12.7.1. Company Overview
12.7.2. Product Offerings
12.7.3. Financial Performance
12.7.4. Recent Initiatives
12.8. LabCorp
12.8.1. Company Overview
12.8.2. Product Offerings
12.8.3. Financial Performance
12.8.4. Recent Initiatives
12.9. Alcura
12.9.1. Company Overview
12.9.2. Product Offerings
12.9.3. Financial Performance
12.9.4. Recent Initiatives
12.10. Parexel International.
12.10.1. Company Overview
12.10.2. Product Offerings
12.10.3. Financial Performance
12.10.4. Recent Initiatives
Chapter 13. Research Methodology
13.1. Primary Research
13.2. Secondary Research
13.3. Assumptions
Chapter 14. Appendix
14.1. About Us
14.2. Glossary of Terms
 Cross-segment Market Size and Analysis for
Mentioned Segments
Additional Company Profiles (Upto 5 With No Cost)
Additional Countries (Apart From Mentioned Countries)
Country/Region-specific Report
Go To Market Strategy
Region Specific Market DynamicsRegion Level Market Share Import Export AnalysisProduction AnalysisOthers
Cross-segment Market Size and Analysis for
Mentioned Segments
Additional Company Profiles (Upto 5 With No Cost)
Additional Countries (Apart From Mentioned Countries)
Country/Region-specific Report
Go To Market Strategy
Region Specific Market DynamicsRegion Level Market Share Import Export AnalysisProduction AnalysisOthers