Containerized Data Center Market Size, Trends, Share, Growth | Report 2023-2032
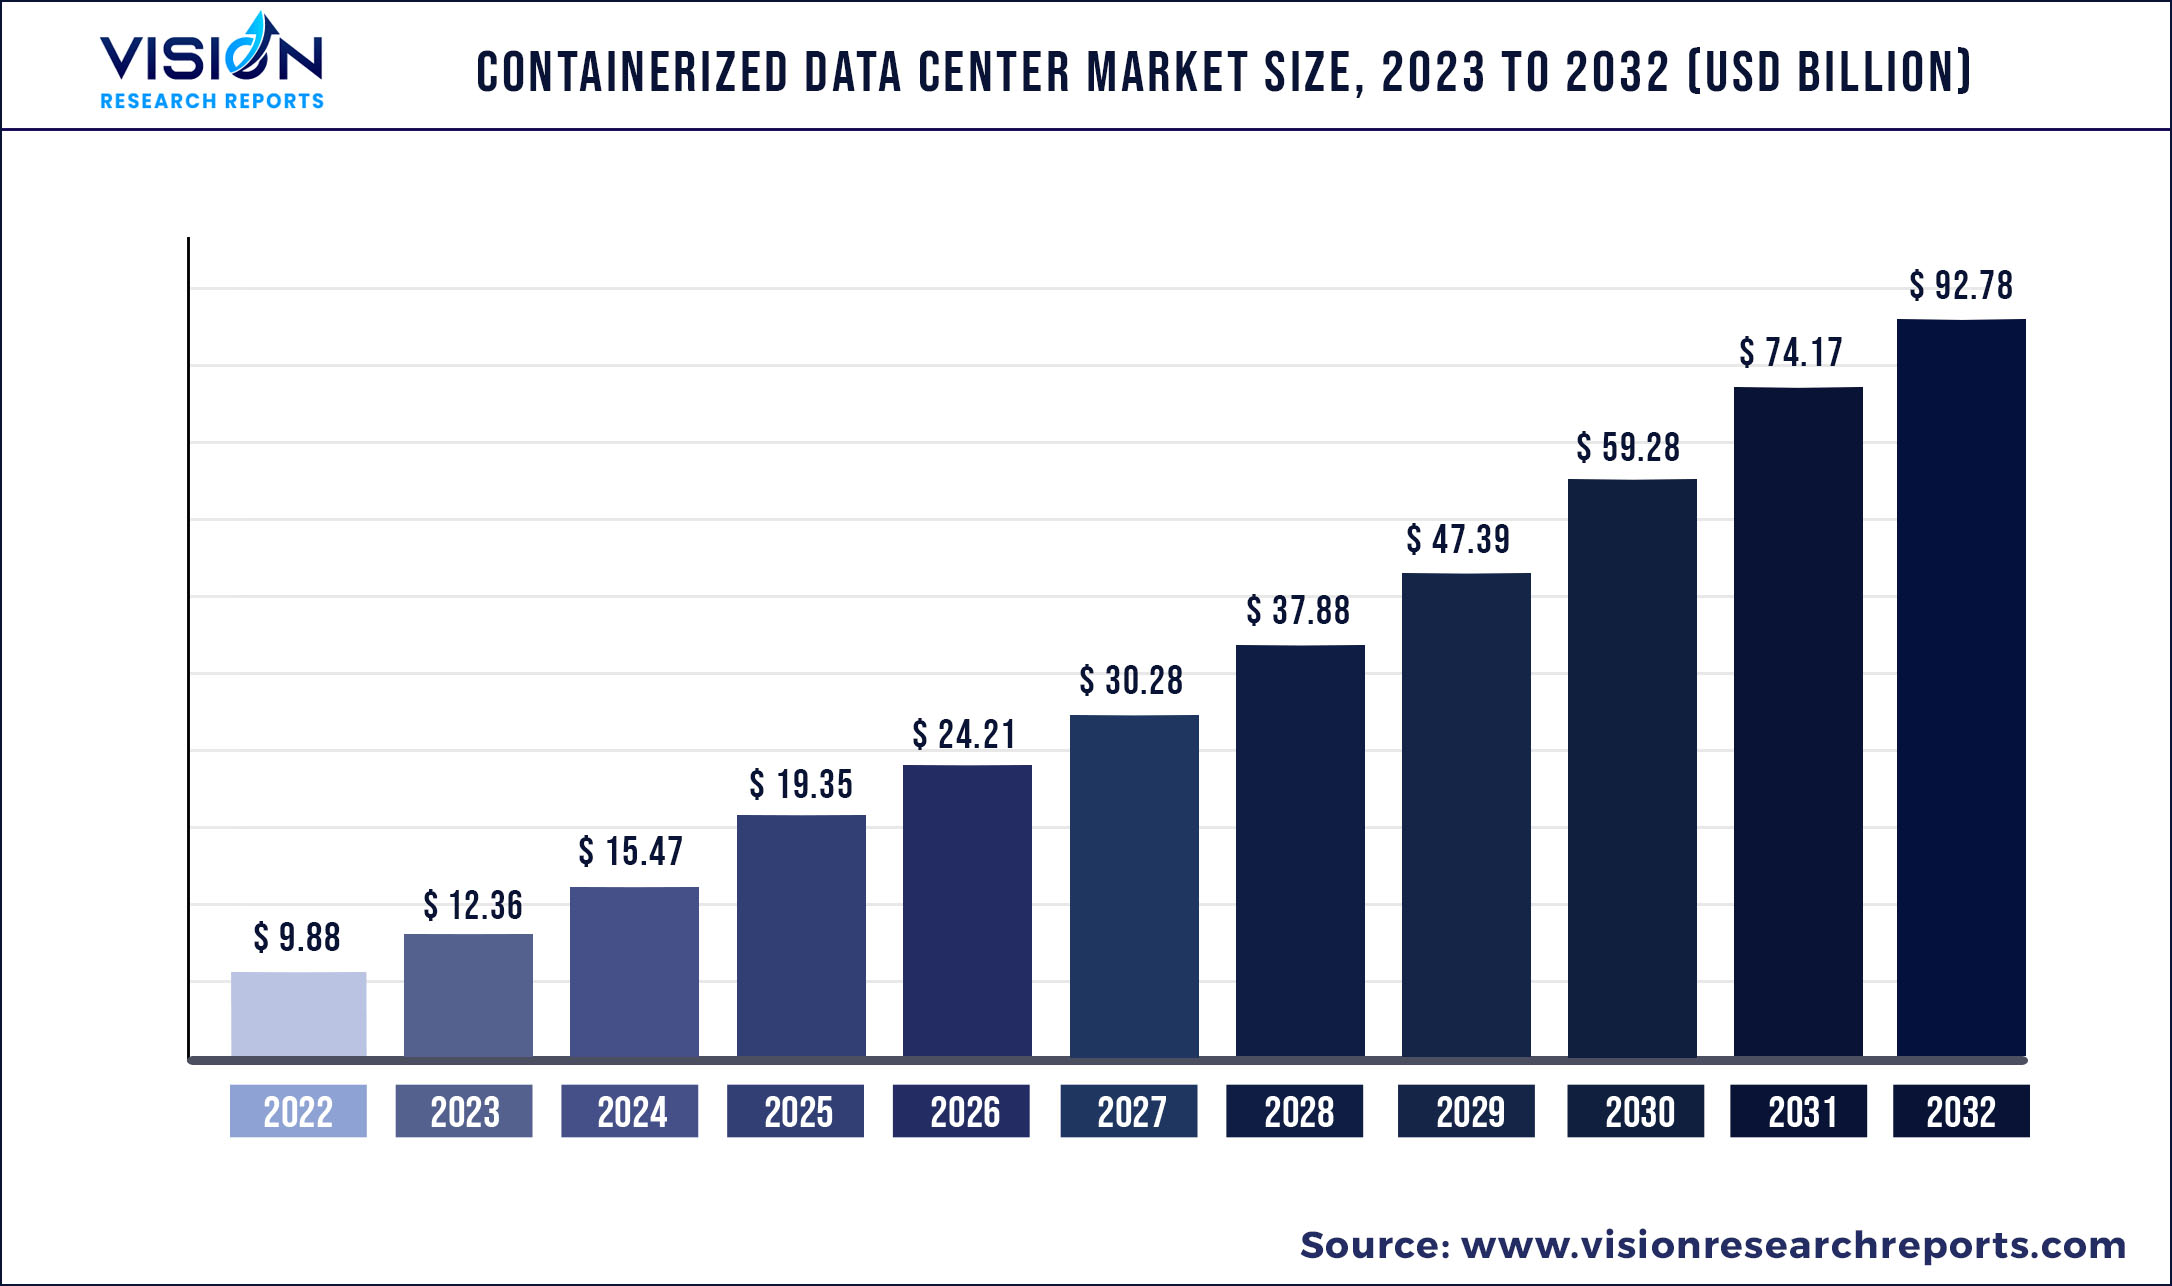
The global containerized data center market was estimated at USD 9.88 billion in 2022 and it is expected to surpass around USD 92.78 billion by 2032, poised to grow at a CAGR of 25.1% from 2023 to 2032.
Key Pointers
Report Scope of the Containerized data center Market
| Report Coverage | Details |
| Market Size in 2022 | USD 9.88 billion |
| Revenue Forecast by 2032 | USD 92.78 billion |
| Growth rate from 2023 to 2032 | CAGR of 25.1% |
| Base Year | 2022 |
| Forecast Period | 2023 to 2032 |
| Regions Covered | North America, Europe, Asia Pacific, Latin America, Middle East & Africa |
| Companies Covered | Cisco Systems, Inc.; IBM; Dell Inc.; Vertiv Group Corp.; Hewlett Packard Enterprise Development LP; Huawei Technologies Co., Ltd.; Schneider Electric; Fuji Electric Co., Ltd.; Delta Power Solutions; Shenzhen Kstar Science & Technology Co., Ltd.; Rittal GmbH & Co. KG; ZTE Corporation |
The growth of the digital economy has accelerated the rapid and vigorous development of technologies such as the Internet of Things, cloud computing, edge computing, and big data, which have raised the demand for data centers. These technologies create high volumes of data in the network, generating new performance and computing demands in the data center, which is ultimately driving the demand for containerized data center solutions and services. In addition, the demand for rapid deployment, portability & durability, high scalability, and energy efficiency is expected to accelerate the growth of the containerized data center market.
The outbreak of COVID-19 played a critical role in driving the containerized data center market growth. The establishment of local data centers gained traction across several parts of the world in line with the rising pressure on organizations to ensure a robust and secure IT environment for their employees and end-users and the growing corporate awareness regarding the benefits of edge computing services, thereby contributing to the data center market growth. The unabated growth of the e-commerce industry and the growing popularity of OTT platforms also contributed to the rising demand for containerized data centers.
The growing reliance on digital technology is expected to continue to drive the preference for multi-tenant, hyper-scale data centers in the post-pandemic era. The growing volumes of digital transactions, the proliferation of smart devices, widespread implementation of IoT technology, the continued rollout of 5G networks, adoption of Industry 4.0, and the potential for the generation of large volumes of data by FinTech, EduTech, GamingTech, HealthTech, ACES mobility, and media & entertainment, among other industries and industry verticals, are some of the vital factors driving the demand for data centers and contributing to the growth of the containerized data center market.
Regional Insights
North America dominated the market with a share of 33.84% in 2022 and is anticipated to retain its position during the forecast period. Early adoption of containerized data centers in this region is the major factor behind the market growth. In addition, the considerable presence of major market players such as Cisco Systems, Inc. (U.S.), Dell Inc. (U.S.), IBM (U.S.), and Vertiv Group Corp. (U.S.) is also boosting the adoption of containerized data centers. The growing demand for agile IT infrastructure and the use of online services are also expected to offer substantial growth opportunities to the data center industry in North America in the near future. For instance, with the growing popularity of edge and cloud computing, numerous organizations are looking to benefit from the flexibility and scalability of this type of infrastructure.
Asia Pacific is anticipated to expand at the fastest CAGR of 26.31% during the forecast period. The sizable presence of collocation data centers, cloud, and internet service providers in the region is the major driver behind the market growth. In addition, rising investment in the IT & telecommunications industry, increasing 5G deployments, and adoption of industrial IoT are also driving demand for containerized data centers in the region.
Containerized data center Market Segmentations:
| By Container Type | By Organization Size | By End-Use Industry |
|
20 Feet Container 40 Feet Container Customized Container |
Small & Medium Sized Organizations Large Size Organizations |
BFSI IT & Telecommunications Healthcare Energy & Utilities Aerospace & Defense Retail & E-commerce Others |
Chapter 1. Introduction
1.1. Research Objective
1.2. Scope of the Study
1.3. Definition
Chapter 2. Research Methodology
2.1. Research Approach
2.2. Data Sources
2.3. Assumptions & Limitations
Chapter 3. Executive Summary
3.1. Market Snapshot
Chapter 4. Market Variables and Scope
4.1. Introduction
4.2. Market Classification and Scope
4.3. Industry Value Chain Analysis
4.3.1. Raw Material Procurement Analysis
4.3.2. Sales and Distribution Container Type Analysis
4.3.3. Downstream Buyer Analysis
Chapter 5. COVID 19 Impact on Containerized Data Center Market
5.1. COVID-19 Landscape: Containerized Data Center Industry Impact
5.2. COVID 19 - Impact Assessment for the Industry
5.3. COVID 19 Impact: Global Major Government Policy
5.4. Market Trends and Opportunities in the COVID-19 Landscape
Chapter 6. Market Dynamics Analysis and Trends
6.1. Market Dynamics
6.1.1. Market Drivers
6.1.2. Market Restraints
6.1.3. Market Opportunities
6.2. Porter’s Five Forces Analysis
6.2.1. Bargaining power of suppliers
6.2.2. Bargaining power of buyers
6.2.3. Threat of substitute
6.2.4. Threat of new entrants
6.2.5. Degree of competition
Chapter 7. Competitive Landscape
7.1.1. Company Market Share/Positioning Analysis
7.1.2. Key Strategies Adopted by Players
7.1.3. Vendor Landscape
7.1.3.1. List of Suppliers
7.1.3.2. List of Buyers
Chapter 8. Global Containerized Data Center Market, By Container Type
8.1. Containerized Data Center Market, by Container Type, 2023-2032
8.1.1 20 Feet Container
8.1.1.1. Market Revenue and Forecast (2020-2032)
8.1.2. 40 Feet Container
8.1.2.1. Market Revenue and Forecast (2020-2032)
8.1.3. Customized Container
8.1.3.1. Market Revenue and Forecast (2020-2032)
Chapter 9. Global Containerized Data Center Market, By Organization Size
9.1. Containerized Data Center Market, by Organization Size, 2023-2032
9.1.1. Small & Medium Sized Organizations
9.1.1.1. Market Revenue and Forecast (2020-2032)
9.1.2. Large Size Organizations
9.1.2.1. Market Revenue and Forecast (2020-2032)
Chapter 10. Global Containerized Data Center Market, By End-Use Industry
10.1. Containerized Data Center Market, by End-Use Industry, 2023-2032
10.1.1. BFSI
10.1.1.1. Market Revenue and Forecast (2020-2032)
10.1.2. IT & Telecommunications
10.1.2.1. Market Revenue and Forecast (2020-2032)
10.1.3. Healthcare
10.1.3.1. Market Revenue and Forecast (2020-2032)
10.1.4. Energy & Utilities
10.1.4.1. Market Revenue and Forecast (2020-2032)
10.1.5. Aerospace & Defense
10.1.5.1. Market Revenue and Forecast (2020-2032)
10.1.6. Retail & E-commerce
10.1.6.1. Market Revenue and Forecast (2020-2032)
10.1.7. Others
10.1.7.1. Market Revenue and Forecast (2020-2032)
Chapter 11. Global Containerized Data Center Market, Regional Estimates and Trend Forecast
11.1. North America
11.1.1. Market Revenue and Forecast, by Container Type (2020-2032)
11.1.2. Market Revenue and Forecast, by Organization Size (2020-2032)
11.1.3. Market Revenue and Forecast, by End-Use Industry (2020-2032)
11.1.4. U.S.
11.1.4.1. Market Revenue and Forecast, by Container Type (2020-2032)
11.1.4.2. Market Revenue and Forecast, by Organization Size (2020-2032)
11.1.4.3. Market Revenue and Forecast, by End-Use Industry (2020-2032)
11.1.5. Rest of North America
11.1.5.1. Market Revenue and Forecast, by Container Type (2020-2032)
11.1.5.2. Market Revenue and Forecast, by Organization Size (2020-2032)
11.1.5.3. Market Revenue and Forecast, by End-Use Industry (2020-2032)
11.2. Europe
11.2.1. Market Revenue and Forecast, by Container Type (2020-2032)
11.2.2. Market Revenue and Forecast, by Organization Size (2020-2032)
11.2.3. Market Revenue and Forecast, by End-Use Industry (2020-2032)
11.2.4. UK
11.2.4.1. Market Revenue and Forecast, by Container Type (2020-2032)
11.2.4.2. Market Revenue and Forecast, by Organization Size (2020-2032)
11.2.4.3. Market Revenue and Forecast, by End-Use Industry (2020-2032)
11.2.5. Germany
11.2.5.1. Market Revenue and Forecast, by Container Type (2020-2032)
11.2.5.2. Market Revenue and Forecast, by Organization Size (2020-2032)
11.2.5.3. Market Revenue and Forecast, by End-Use Industry (2020-2032)
11.2.6. France
11.2.6.1. Market Revenue and Forecast, by Container Type (2020-2032)
11.2.6.2. Market Revenue and Forecast, by Organization Size (2020-2032)
11.2.6.3. Market Revenue and Forecast, by End-Use Industry (2020-2032)
11.2.7. Rest of Europe
11.2.7.1. Market Revenue and Forecast, by Container Type (2020-2032)
11.2.7.2. Market Revenue and Forecast, by Organization Size (2020-2032)
11.2.7.3. Market Revenue and Forecast, by End-Use Industry (2020-2032)
11.3. APAC
11.3.1. Market Revenue and Forecast, by Container Type (2020-2032)
11.3.2. Market Revenue and Forecast, by Organization Size (2020-2032)
11.3.3. Market Revenue and Forecast, by End-Use Industry (2020-2032)
11.3.4. India
11.3.4.1. Market Revenue and Forecast, by Container Type (2020-2032)
11.3.4.2. Market Revenue and Forecast, by Organization Size (2020-2032)
11.3.4.3. Market Revenue and Forecast, by End-Use Industry (2020-2032)
11.3.5. China
11.3.5.1. Market Revenue and Forecast, by Container Type (2020-2032)
11.3.5.2. Market Revenue and Forecast, by Organization Size (2020-2032)
11.3.5.3. Market Revenue and Forecast, by End-Use Industry (2020-2032)
11.3.6. Japan
11.3.6.1. Market Revenue and Forecast, by Container Type (2020-2032)
11.3.6.2. Market Revenue and Forecast, by Organization Size (2020-2032)
11.3.6.3. Market Revenue and Forecast, by End-Use Industry (2020-2032)
11.3.7. Rest of APAC
11.3.7.1. Market Revenue and Forecast, by Container Type (2020-2032)
11.3.7.2. Market Revenue and Forecast, by Organization Size (2020-2032)
11.3.7.3. Market Revenue and Forecast, by End-Use Industry (2020-2032)
11.4. MEA
11.4.1. Market Revenue and Forecast, by Container Type (2020-2032)
11.4.2. Market Revenue and Forecast, by Organization Size (2020-2032)
11.4.3. Market Revenue and Forecast, by End-Use Industry (2020-2032)
11.4.4. GCC
11.4.4.1. Market Revenue and Forecast, by Container Type (2020-2032)
11.4.4.2. Market Revenue and Forecast, by Organization Size (2020-2032)
11.4.4.3. Market Revenue and Forecast, by End-Use Industry (2020-2032)
11.4.5. North Africa
11.4.5.1. Market Revenue and Forecast, by Container Type (2020-2032)
11.4.5.2. Market Revenue and Forecast, by Organization Size (2020-2032)
11.4.5.3. Market Revenue and Forecast, by End-Use Industry (2020-2032)
11.4.6. South Africa
11.4.6.1. Market Revenue and Forecast, by Container Type (2020-2032)
11.4.6.2. Market Revenue and Forecast, by Organization Size (2020-2032)
11.4.6.3. Market Revenue and Forecast, by End-Use Industry (2020-2032)
11.4.7. Rest of MEA
11.4.7.1. Market Revenue and Forecast, by Container Type (2020-2032)
11.4.7.2. Market Revenue and Forecast, by Organization Size (2020-2032)
11.4.7.3. Market Revenue and Forecast, by End-Use Industry (2020-2032)
11.5. Latin America
11.5.1. Market Revenue and Forecast, by Container Type (2020-2032)
11.5.2. Market Revenue and Forecast, by Organization Size (2020-2032)
11.5.3. Market Revenue and Forecast, by End-Use Industry (2020-2032)
11.5.4. Brazil
11.5.4.1. Market Revenue and Forecast, by Container Type (2020-2032)
11.5.4.2. Market Revenue and Forecast, by Organization Size (2020-2032)
11.5.4.3. Market Revenue and Forecast, by End-Use Industry (2020-2032)
11.5.5. Rest of LATAM
11.5.5.1. Market Revenue and Forecast, by Container Type (2020-2032)
11.5.5.2. Market Revenue and Forecast, by Organization Size (2020-2032)
11.5.5.3. Market Revenue and Forecast, by End-Use Industry (2020-2032)
Chapter 12. Company Profiles
12.1. Cisco Systems, Inc.
12.1.1. Company Overview
12.1.2. Product Offerings
12.1.3. Financial Performance
12.1.4. Recent Initiatives
12.2. IBM
12.2.1. Company Overview
12.2.2. Product Offerings
12.2.3. Financial Performance
12.2.4. Recent Initiatives
12.3. Dell Inc.
12.3.1. Company Overview
12.3.2. Product Offerings
12.3.3. Financial Performance
12.3.4. Recent Initiatives
12.4. Vertiv Group Corp.
12.4.1. Company Overview
12.4.2. Product Offerings
12.4.3. Financial Performance
12.4.4. Recent Initiatives
12.5. Hewlett Packard Enterprise Development LP
12.5.1. Company Overview
12.5.2. Product Offerings
12.5.3. Financial Performance
12.5.4. Recent Initiatives
12.6. Huawei Technologies Co., Ltd.
12.6.1. Company Overview
12.6.2. Product Offerings
12.6.3. Financial Performance
12.6.4. Recent Initiatives
12.7. Schneider Electric
12.7.1. Company Overview
12.7.2. Product Offerings
12.7.3. Financial Performance
12.7.4. Recent Initiatives
12.8. Fuji Electric Co., Ltd.
12.8.1. Company Overview
12.8.2. Product Offerings
12.8.3. Financial Performance
12.8.4. Recent Initiatives
12.9. Delta Power Solutions
12.9.1. Company Overview
12.9.2. Product Offerings
12.9.3. Financial Performance
12.9.4. Recent Initiatives
12.10. Shenzhen Kstar Science & Technology Co., Ltd.
12.10.1. Company Overview
12.10.2. Product Offerings
12.10.3. Financial Performance
12.10.4. Recent Initiatives
Chapter 13. Research Methodology
13.1. Primary Research
13.2. Secondary Research
13.3. Assumptions
Chapter 14. Appendix
14.1. About Us
14.2. Glossary of Terms
 Cross-segment Market Size and Analysis for
Mentioned Segments
Additional Company Profiles (Upto 5 With No Cost)
Additional Countries (Apart From Mentioned Countries)
Country/Region-specific Report
Go To Market Strategy
Region Specific Market DynamicsRegion Level Market Share Import Export AnalysisProduction AnalysisOthers
Cross-segment Market Size and Analysis for
Mentioned Segments
Additional Company Profiles (Upto 5 With No Cost)
Additional Countries (Apart From Mentioned Countries)
Country/Region-specific Report
Go To Market Strategy
Region Specific Market DynamicsRegion Level Market Share Import Export AnalysisProduction AnalysisOthers