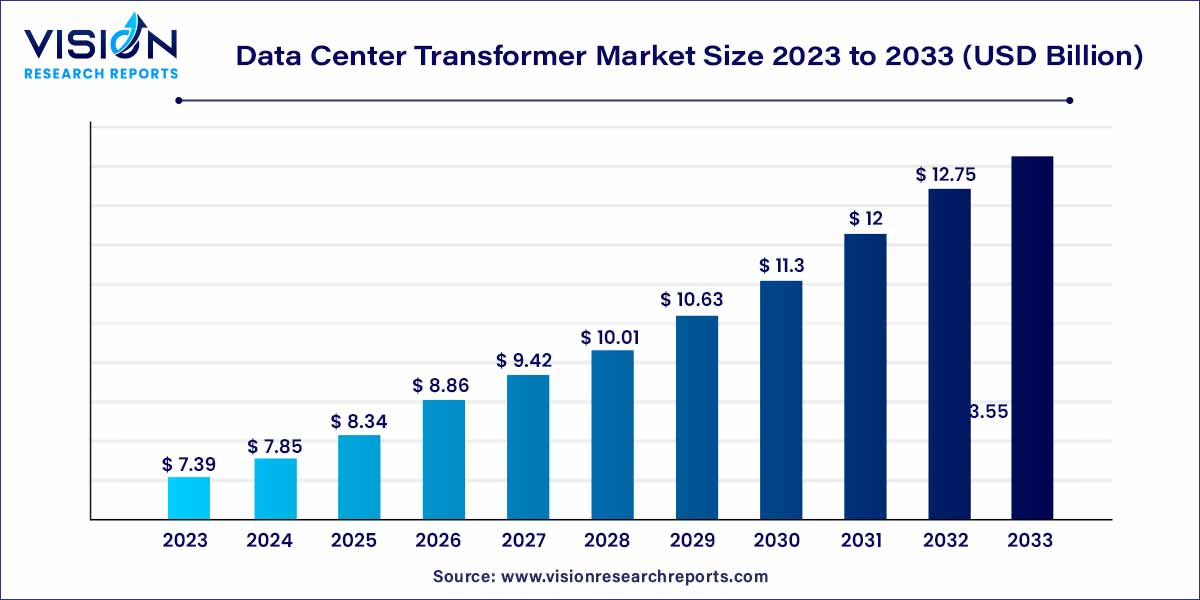
The global data center transformer market size was estimated at around USD 7.39 billion in 2023 and it is projected to hit around USD 13.55 billion by 2033, growing at a CAGR of 6.25% from 2024 to 2033.

The data center transformer market plays a pivotal role in the robust functioning of contemporary data centers, acting as a critical component in their power infrastructure. As data centers become increasingly integral to digital operations, the demand for efficient and reliable transformers has surged. This overview provides insights into the key facets shaping the data center transformer market.
The growth of the data center transformer market is fueled by several key factors. Firstly, the increasing construction of data centers globally is a primary driver, as the surge in data generation necessitates robust power infrastructure. Additionally, there is a growing emphasis on energy efficiency within the industry, prompting data center operators to adopt transformers that minimize energy loss and align with sustainability goals. Technological advancements, including the development of smart transformers with advanced monitoring capabilities, contribute significantly to the market's expansion. Moreover, stringent government regulations regarding energy consumption and environmental impact are compelling organizations to invest in high-efficiency transformers that meet industry standards. The rising demand for cloud services further propels market growth, as efficient transformers play a critical role in ensuring seamless power distribution for cloud-based applications and services. Overall, these interconnected factors underscore the positive trajectory of the data center transformer market, making it a pivotal component in the evolving landscape of data center infrastructure.
| Report Coverage | Details |
| Market Revenue by 2033 | USD 13.55 billion |
| Growth Rate from 2024 to 2033 | CAGR of 6.25% |
| Revenue Share of North America in 2023 | 39% |
| CAGR of Asia Pacific from 2024 to 2033 | 8.75% |
| Base Year | 2023 |
| Forecast Period | 2024 to 2033 |
| Market Analysis (Terms Used) | Value (US$ Million/Billion) or (Volume/Units) |
The oil immersed segment dominated the global market with the largest market share of 78% in 2023. The oil immersed type insulation transformer offers effective heat removal, thus reducing electrical losses and optimizing the performance of the system. It also ensures low noise levels, resulting in quieter operation. The oil immersed type transformer is designed to work at higher loads and offers better efficiency and service life, which is expected to boost the segment growth.
The dry insulation segment is projected to expand at the fastest CAGR of 7.13% over the forecast period. Dry type insulation transformer ensures a safe working environment with zero fire hazard risks as it uses air as a cooling medium. Additionally, the dry insulation type transformers have no moving parts, and thus need less maintenance. Although the initial investment cost associated with dry insulation is high, it offers long-term cost benefits and is considered to be a one-time investment by the users. Moreover, the dry type transformers use Underwriter Laboratories (UL) and CSA Group (CSA) based environmentally safe temperature insulation systems and are eco-friendly, which is expected to bolster the growth of the dry type segment.
The1,250-3,750 kVA segment accounted for the largest revenue share of 43% in 2023. This size range offers a good balance of power capacity and efficiency, making it ideal for a wide range of data center sizes and configurations. Additionally, transformers in this size range are relatively affordable, making them a cost-effective option for many data center operators.
The over 3,750 kVA segment is estimated to register the fastest CAGR of 7.93% over the forecast period owing to its increased use in large data centers. The demand for large data centers is growing rapidly, as more and more businesses and organizations rely on data centers to store and process information. These large data centers need more power than smaller data centers, and transformers in this size range can provide the necessary power.
The OEMs segment accounted held the largest revenue share of 57% in 2023 and is expected to grow at the fastest CAGR of 6.84% during the forecast period. OEM transformers are typically designed and manufactured specifically for data center applications, and they come with a warranty and support from the manufacturer.

The distributors segment is expected to grow at a significant CAGR of 5.97% over the forecast period. Distributors typically have a wide range of transformers in stock, which can save data center operators time and money. Distributors also offer technical support and other services that can be helpful to data center operators.
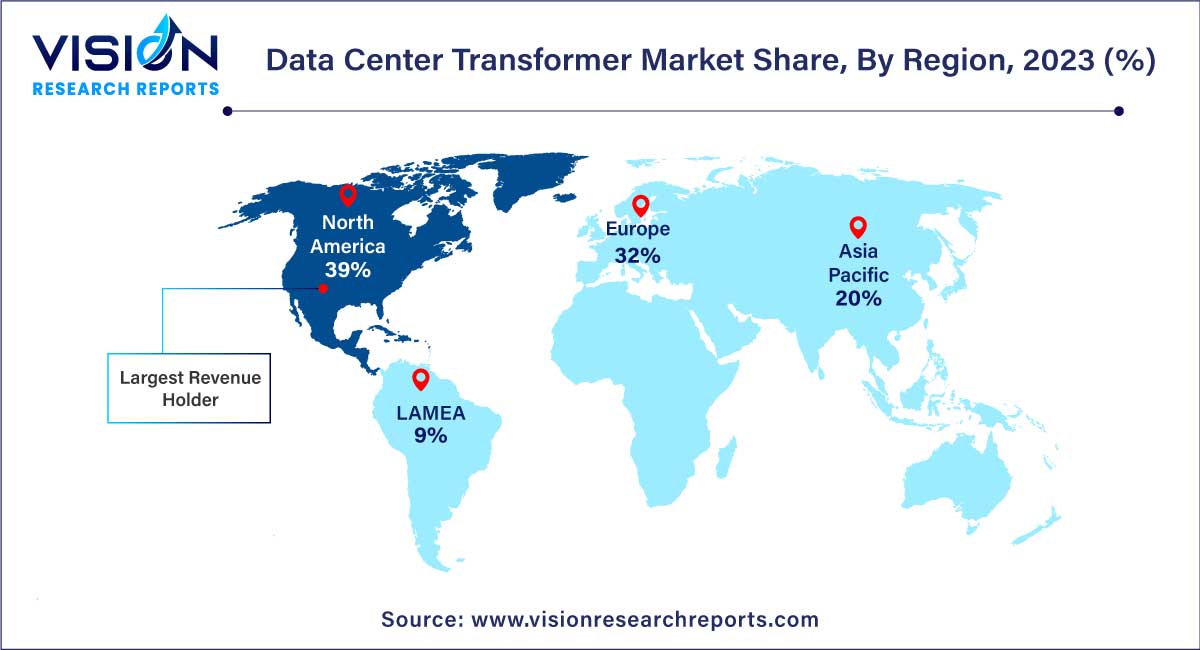
North America led the market with the largest market share of 39% in 2023. This is attributed to the presence of major players such as Eaton and General Electric. Advanced technological development and technical awareness amongst the users in the region are also expected to have a positive impact on market growth. Moreover, the presence of several data centers in the region is a crucial factor expected to drive the regional market.

Asia Pacific is the fastest-growing regional market for data center transformers with a CAGR of 8.75% over the forecast period. Increasing demand for data storage and cloud-based applications is contributing to the growth of the regional market. Implementation of cloud-based services in sectors, like education and healthcare, coupled with support from the governments, has increased the construction of data centers in this region. Furthermore, the high penetration of smartphones and internet availability, along with increased demand for mobility, is projected to increase the number of data centers in this region, which is expected to directly contribute to the growth of the market.
By Insulation Type
By Voltage
By Channel Partners
By Region
Chapter 1. Introduction
1.1. Research Objective
1.2. Scope of the Study
1.3. Definition
Chapter 2. Research Methodology
2.1. Research Approach
2.2. Data Sources
2.3. Assumptions & Limitations
Chapter 3. Executive Summary
3.1. Market Snapshot
Chapter 4. Market Variables and Scope
4.1. Introduction
4.2. Market Classification and Scope
4.3. Industry Value Chain Analysis
4.3.1. Raw Material Procurement Analysis
4.3.2. Sales and Distribution Insulation Type Analysis
4.3.3. Downstream Buyer Analysis
Chapter 5. COVID 19 Impact on Data Center Transformer Market
5.1. COVID-19 Landscape: Data Center Transformer Industry Impact
5.2. COVID 19 - Impact Assessment for the Industry
5.3. COVID 19 Impact: Global Major Government Policy
5.4. Market Trends and Opportunities in the COVID-19 Landscape
Chapter 6. Market Dynamics Analysis and Trends
6.1. Market Dynamics
6.1.1. Market Drivers
6.1.2. Market Restraints
6.1.3. Market Opportunities
6.2. Porter’s Five Forces Analysis
6.2.1. Bargaining power of suppliers
6.2.2. Bargaining power of buyers
6.2.3. Threat of substitute
6.2.4. Threat of new entrants
6.2.5. Degree of competition
Chapter 7. Competitive Landscape
7.1.1. Company Market Share/Positioning Analysis
7.1.2. Key Strategies Adopted by Players
7.1.3. Vendor Landscape
7.1.3.1. List of Suppliers
7.1.3.2. List of Buyers
Chapter 8. Global Data Center Transformer Market, By Insulation Type
8.1. Data Center Transformer Market, by Insulation Type, 2024-2033
8.1.1 Oil Immersed
8.1.1.1. Market Revenue and Forecast (2021-2033)
8.1.2. Dry
8.1.2.1. Market Revenue and Forecast (2021-2033)
Chapter 9. Global Data Center Transformer Market, By Voltage
9.1. Data Center Transformer Market, by Voltage, 2024-2033
9.1.1. Below 625 kVA
9.1.1.1. Market Revenue and Forecast (2021-2033)
9.1.2. 625-1,250 kVA
9.1.2.1. Market Revenue and Forecast (2021-2033)
9.1.3. 1,250-3,750 kVA
9.1.3.1. Market Revenue and Forecast (2021-2033)
9.1.4. Over 3,750 kVA
9.1.4.1. Market Revenue and Forecast (2021-2033)
Chapter 10. Global Data Center Transformer Market, By Channel Partners
10.1. Data Center Transformer Market, by Channel Partners, 2024-2033
10.1.1. OEMs
10.1.1.1. Market Revenue and Forecast (2021-2033)
10.1.2. Distributors
10.1.2.1. Market Revenue and Forecast (2021-2033)
10.1.3. Online Retailers
10.1.3.1. Market Revenue and Forecast (2021-2033)
10.1.4. Electrical Contractors
10.1.4.1. Market Revenue and Forecast (2021-2033)
Chapter 11. Global Data Center Transformer Market, Regional Estimates and Trend Forecast
11.1. North America
11.1.1. Market Revenue and Forecast, by Insulation Type (2021-2033)
11.1.2. Market Revenue and Forecast, by Voltage (2021-2033)
11.1.3. Market Revenue and Forecast, by Channel Partners (2021-2033)
11.1.4. U.S.
11.1.4.1. Market Revenue and Forecast, by Insulation Type (2021-2033)
11.1.4.2. Market Revenue and Forecast, by Voltage (2021-2033)
11.1.4.3. Market Revenue and Forecast, by Channel Partners (2021-2033)
11.1.5. Rest of North America
11.1.5.1. Market Revenue and Forecast, by Insulation Type (2021-2033)
11.1.5.2. Market Revenue and Forecast, by Voltage (2021-2033)
11.1.5.3. Market Revenue and Forecast, by Channel Partners (2021-2033)
11.2. Europe
11.2.1. Market Revenue and Forecast, by Insulation Type (2021-2033)
11.2.2. Market Revenue and Forecast, by Voltage (2021-2033)
11.2.3. Market Revenue and Forecast, by Channel Partners (2021-2033)
11.2.4. UK
11.2.4.1. Market Revenue and Forecast, by Insulation Type (2021-2033)
11.2.4.2. Market Revenue and Forecast, by Voltage (2021-2033)
11.2.4.3. Market Revenue and Forecast, by Channel Partners (2021-2033)
11.2.5. Germany
11.2.5.1. Market Revenue and Forecast, by Insulation Type (2021-2033)
11.2.5.2. Market Revenue and Forecast, by Voltage (2021-2033)
11.2.5.3. Market Revenue and Forecast, by Channel Partners (2021-2033)
11.2.6. France
11.2.6.1. Market Revenue and Forecast, by Insulation Type (2021-2033)
11.2.6.2. Market Revenue and Forecast, by Voltage (2021-2033)
11.2.6.3. Market Revenue and Forecast, by Channel Partners (2021-2033)
11.2.7. Rest of Europe
11.2.7.1. Market Revenue and Forecast, by Insulation Type (2021-2033)
11.2.7.2. Market Revenue and Forecast, by Voltage (2021-2033)
11.2.7.3. Market Revenue and Forecast, by Channel Partners (2021-2033)
11.3. APAC
11.3.1. Market Revenue and Forecast, by Insulation Type (2021-2033)
11.3.2. Market Revenue and Forecast, by Voltage (2021-2033)
11.3.3. Market Revenue and Forecast, by Channel Partners (2021-2033)
11.3.4. India
11.3.4.1. Market Revenue and Forecast, by Insulation Type (2021-2033)
11.3.4.2. Market Revenue and Forecast, by Voltage (2021-2033)
11.3.4.3. Market Revenue and Forecast, by Channel Partners (2021-2033)
11.3.5. China
11.3.5.1. Market Revenue and Forecast, by Insulation Type (2021-2033)
11.3.5.2. Market Revenue and Forecast, by Voltage (2021-2033)
11.3.5.3. Market Revenue and Forecast, by Channel Partners (2021-2033)
11.3.6. Japan
11.3.6.1. Market Revenue and Forecast, by Insulation Type (2021-2033)
11.3.6.2. Market Revenue and Forecast, by Voltage (2021-2033)
11.3.6.3. Market Revenue and Forecast, by Channel Partners (2021-2033)
11.3.7. Rest of APAC
11.3.7.1. Market Revenue and Forecast, by Insulation Type (2021-2033)
11.3.7.2. Market Revenue and Forecast, by Voltage (2021-2033)
11.3.7.3. Market Revenue and Forecast, by Channel Partners (2021-2033)
11.4. MEA
11.4.1. Market Revenue and Forecast, by Insulation Type (2021-2033)
11.4.2. Market Revenue and Forecast, by Voltage (2021-2033)
11.4.3. Market Revenue and Forecast, by Channel Partners (2021-2033)
11.4.4. GCC
11.4.4.1. Market Revenue and Forecast, by Insulation Type (2021-2033)
11.4.4.2. Market Revenue and Forecast, by Voltage (2021-2033)
11.4.4.3. Market Revenue and Forecast, by Channel Partners (2021-2033)
11.4.5. North Africa
11.4.5.1. Market Revenue and Forecast, by Insulation Type (2021-2033)
11.4.5.2. Market Revenue and Forecast, by Voltage (2021-2033)
11.4.5.3. Market Revenue and Forecast, by Channel Partners (2021-2033)
11.4.6. South Africa
11.4.6.1. Market Revenue and Forecast, by Insulation Type (2021-2033)
11.4.6.2. Market Revenue and Forecast, by Voltage (2021-2033)
11.4.6.3. Market Revenue and Forecast, by Channel Partners (2021-2033)
11.4.7. Rest of MEA
11.4.7.1. Market Revenue and Forecast, by Insulation Type (2021-2033)
11.4.7.2. Market Revenue and Forecast, by Voltage (2021-2033)
11.4.7.3. Market Revenue and Forecast, by Channel Partners (2021-2033)
11.5. Latin America
11.5.1. Market Revenue and Forecast, by Insulation Type (2021-2033)
11.5.2. Market Revenue and Forecast, by Voltage (2021-2033)
11.5.3. Market Revenue and Forecast, by Channel Partners (2021-2033)
11.5.4. Brazil
11.5.4.1. Market Revenue and Forecast, by Insulation Type (2021-2033)
11.5.4.2. Market Revenue and Forecast, by Voltage (2021-2033)
11.5.4.3. Market Revenue and Forecast, by Channel Partners (2021-2033)
11.5.5. Rest of LATAM
11.5.5.1. Market Revenue and Forecast, by Insulation Type (2021-2033)
11.5.5.2. Market Revenue and Forecast, by Voltage (2021-2033)
11.5.5.3. Market Revenue and Forecast, by Channel Partners (2021-2033)
Chapter 12. Company Profiles
12.1. ABB.
12.1.1. Company Overview
12.1.2. Product Offerings
12.1.3. Financial Performance
12.1.4. Recent Initiatives
12.2. Eaton.
12.2.1. Company Overview
12.2.2. Product Offerings
12.2.3. Financial Performance
12.2.4. Recent Initiatives
12.3. General Electric.
12.3.1. Company Overview
12.3.2. Product Offerings
12.3.3. Financial Performance
12.3.4. Recent Initiatives
12.4. HYOSUNG HEAVY INDUSTRIES.
12.4.1. Company Overview
12.4.2. Product Offerings
12.4.3. Financial Performance
12.4.4. Recent Initiatives
12.5. Legrand.
12.5.1. Company Overview
12.5.2. Product Offerings
12.5.3. Financial Performance
12.5.4. Recent Initiatives
12.6. Schneider Electric
12.6.1. Company Overview
12.6.2. Product Offerings
12.6.3. Financial Performance
12.6.4. Recent Initiatives
12.7. Siemens.
12.7.1. Company Overview
12.7.2. Product Offerings
12.7.3. Financial Performance
12.7.4. Recent Initiatives
12.8. VTC/GT
12.8.1. Company Overview
12.8.2. Product Offerings
12.8.3. Financial Performance
12.8.4. Recent Initiatives
12.9. Vertiv Group Corp.
12.9.1. Company Overview
12.9.2. Product Offerings
12.9.3. Financial Performance
12.9.4. Recent Initiatives
Chapter 13. Research Methodology
13.1. Primary Research
13.2. Secondary Research
13.3. Assumptions
Chapter 14. Appendix
14.1. About Us
14.2. Glossary of Terms
 Cross-segment Market Size and Analysis for
Mentioned Segments
 Additional Company Profiles (Upto 5 With No Cost)
 Additional Countries (Apart From Mentioned Countries)
 Country/Region-specific Report
 Go To Market Strategy
 Region Specific Market Dynamics
 Region Level Market Share
 Import Export Analysis
 Production Analysis
 Others