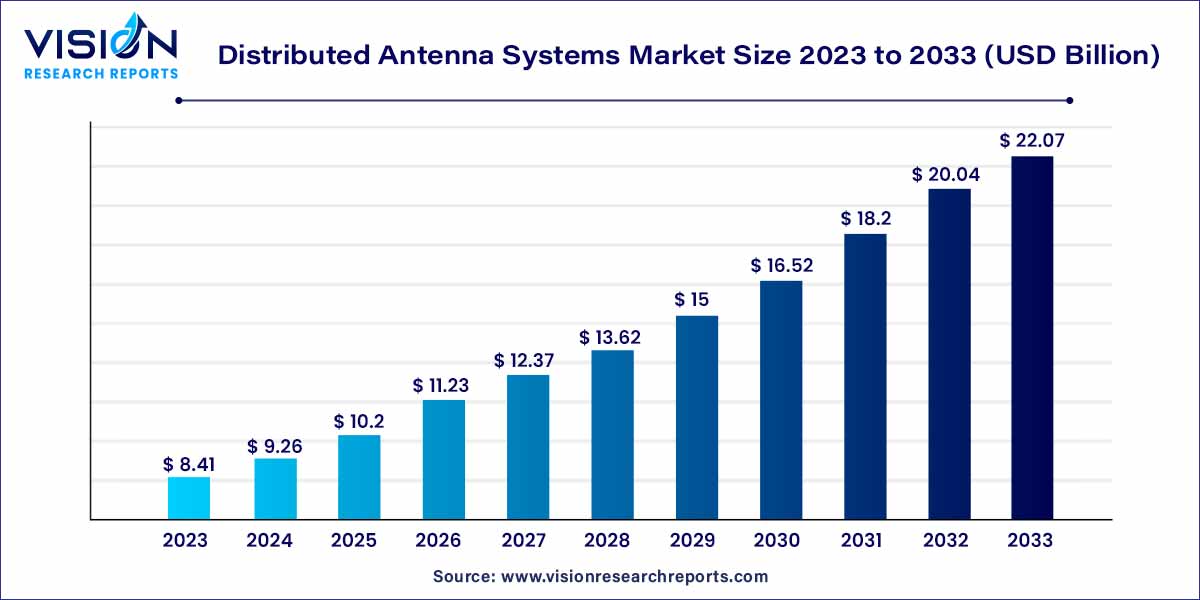
The global distributed antenna systems market size was estimated at around USD 8.41 billion in 2023 and it is projected to hit around USD 22.07 billion by 2033, growing at a CAGR of 10.13% from 2024 to 2033. The market for Distributed Antenna Systems (DAS) has seen a sharp increase in demand due to the growing requirement for high-speed data transmission. Better data services, less coverage gaps, and increased coverage with less power usage are just a few benefits of DAS.

The distributed antenna systems (DAS) market stands as a pivotal force in the ever-evolving landscape of wireless communication. At its core, DAS is a network of antennas strategically placed to enhance wireless coverage and capacity in a given area. This technology has become increasingly integral in addressing the escalating demand for seamless connectivity, driven by the proliferation of smart devices and the relentless expansion of the digital ecosystem.
The growth of the distributed antenna systems (DAS) market is propelled by a confluence of factors that underscore its increasing significance in the realm of wireless communication. Firstly, the relentless surge in the demand for seamless connectivity, accentuated by the ubiquitous use of smart devices, serves as a primary growth driver. As our digital ecosystem expands, so does the need for robust wireless coverage, positioning DAS as a pivotal solution to address this imperative. Additionally, the advent of 5G technology amplifies the growth trajectory, as DAS becomes instrumental in supporting the heightened data speeds and connectivity demands associated with the next generation of wireless communication. Moreover, the evolving landscape of smart cities and the proliferation of Internet of Things (IoT) further contribute to the escalating demand for distributed antenna systems.
| Report Coverage | Details |
| Growth Rate from 2024 to 2033 | CAGR of 10.13% |
| Market Revenue by 2033 | USD 22.07 billion |
| Revenue Share of North America in 2023 | 31% |
| CAGR of Asia Pacific from 2024 to 2033 | 12.17% |
| Base Year | 2023 |
| Forecast Period | 2024 to 2033 |
| Market Analysis (Terms Used) | Value (US$ Million/Billion) or (Volume/Units) |
Rising Demand for Seamless Connectivity:
The ubiquitous use of smart devices and the increasing dependence on data connectivity propel the demand for distributed antenna systems, ensuring comprehensive and uninterrupted wireless coverage.
5G Technology Adoption:
The advent of 5G technology serves as a significant driver, requiring advanced infrastructure solutions like DAS to support the heightened data speeds and connectivity demands associated with the next generation of wireless communication.
Complex Installation Process:
The intricate nature of DAS installations, especially in large and complex environments, can lead to prolonged deployment timelines. This complexity may act as a deterrent for organizations seeking rapid implementation of wireless communication solutions.
Interference Issues:
In certain scenarios, interference issues may arise within the DAS network, impacting the quality of wireless connectivity. Identifying and mitigating interference challenges can be a complex task, influencing the overall effectiveness of the system.
5G Expansion:
The global rollout of 5G networks presents a significant opportunity for the DAS market. As 5G technology becomes more prevalent, DAS will play a crucial role in providing the necessary infrastructure to support the increased data speeds and connectivity demands associated with this next generation of wireless communication.
IoT Integration:
The growing integration of the Internet of Things (IoT) across various industries opens up new vistas for DAS applications. DAS can facilitate seamless connectivity for the myriad of IoT devices, contributing to the development of smart cities, industries, and homes.
The hybrid DAS segment held the highest market share of 50% in 2023. The segment is expected to grow as it offers efficient data connectivity during unusual or fluctuating signal problems. Moreover, these systems have minimal design and installation time, a primary factor expected to drive segment growth over the forecast period. Hybrid DAS is widely preferred among users because of its enhanced coverage and economical cost compared to other DAS technologies.
The active DAS segment is estimated to register a significant CAGR of 8.72% over the forecast period. The increasing demand for reliable and high-capacity wireless connectivity in various industries and sectors drives the growth of the active DAS segment in the market. The need for seamless communication, enhanced coverage, support for multiple frequency bands, and advanced network management capabilities contribute to the adoption and expansion of active DAS solutions.
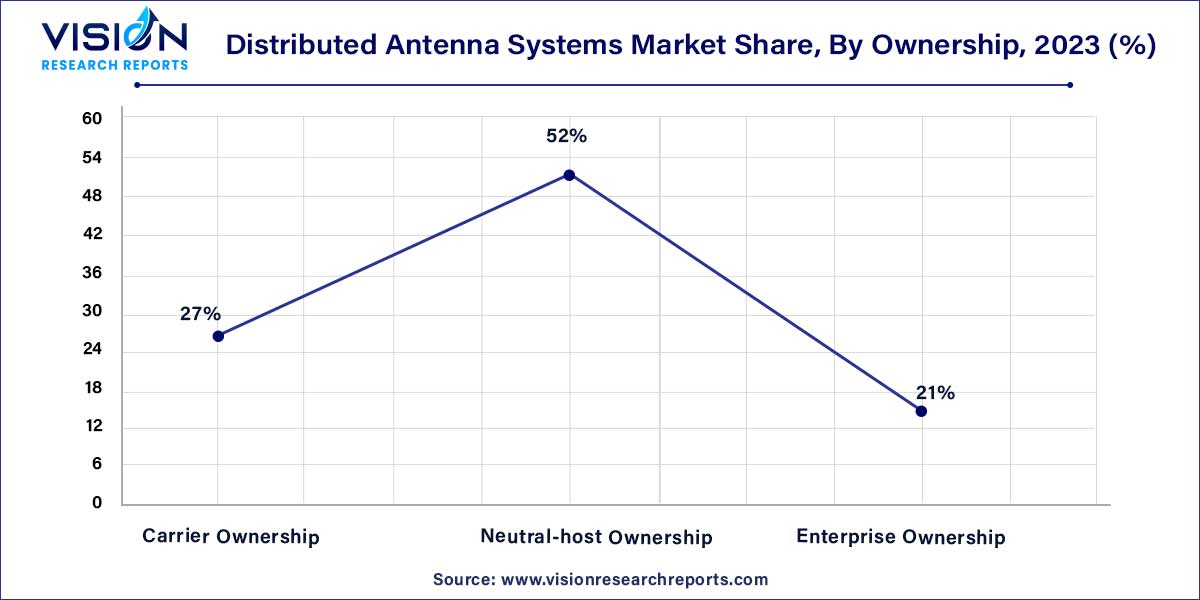
The neutral-host ownership segment dominated the market with a revenue share of 52% in 2023 and is anticipated to retain its position over the forecast period. The neutral-host ownership model provides numerous benefits when third-party system integrators initiate the funding. In cooperation with multiple carriers, these system integrators form a group to install DAS.
Moreover, the host company obtains exclusive rights to the system, and the end-user receives a multicarrier DAS. Neutral-host ownership provides numerous benefits, including improved coverage and quality of service, increased capacity, capital cost reduction, and improved speed to market for service providers.

For instance, in June 2023, Ericsson and Proptivity launched the world's first shared indoor 5G network led by a neutral host, utilizing the Radio Dot System. This groundbreaking deployment occurred in a central Stockholm property encompassing a shopping mall and office spaces. The introduction of this innovative solution delivers high-speed 5G connectivity to visitors and employees, enabling impressive download speeds of up to 1.2 Gbps across the entire building.
The carrier ownership segment is estimated to register a significant CAGR of 8.54% over the forecast period. With the proliferation of smartphones, tablets, and other mobile devices, there has been a significant surge in mobile data consumption. Users expect reliable and high-speed connectivity for various applications, including video streaming, social media, and online gaming. DAS technology enables carriers to enhance network coverage and capacity in high-traffic areas, such as stadiums, airports, shopping malls, and urban centers.
The public venues and safety segment led the market with the highest market share of 27% in 2023. The consistent rise in construction activities in commercial infrastructure is a key factor affecting the growth. Public venues include conference and convention centers, shopping malls, theaters, and fairgrounds, where patrons and employees expect a seamless mobile data experience. DAS in this application will eradicate poor wireless coverage and enable higher customer and employee data output.
The healthcare segment is anticipated to grow at the noteworthy CAGR of 10.75% over the forecast period. Consumers in this sector depend highly on efficient data connectivity to perform their daily activities. Doctors or staff require fully integrated systems to improve operational efficiency and productivity. Additionally, distributed antenna systems in the healthcare sector offer enhanced data connectivity to visitors and staff, which aids in eliminating poor wireless coverage between buildings, reduces interference, and maintains improved signal and coverage quality.
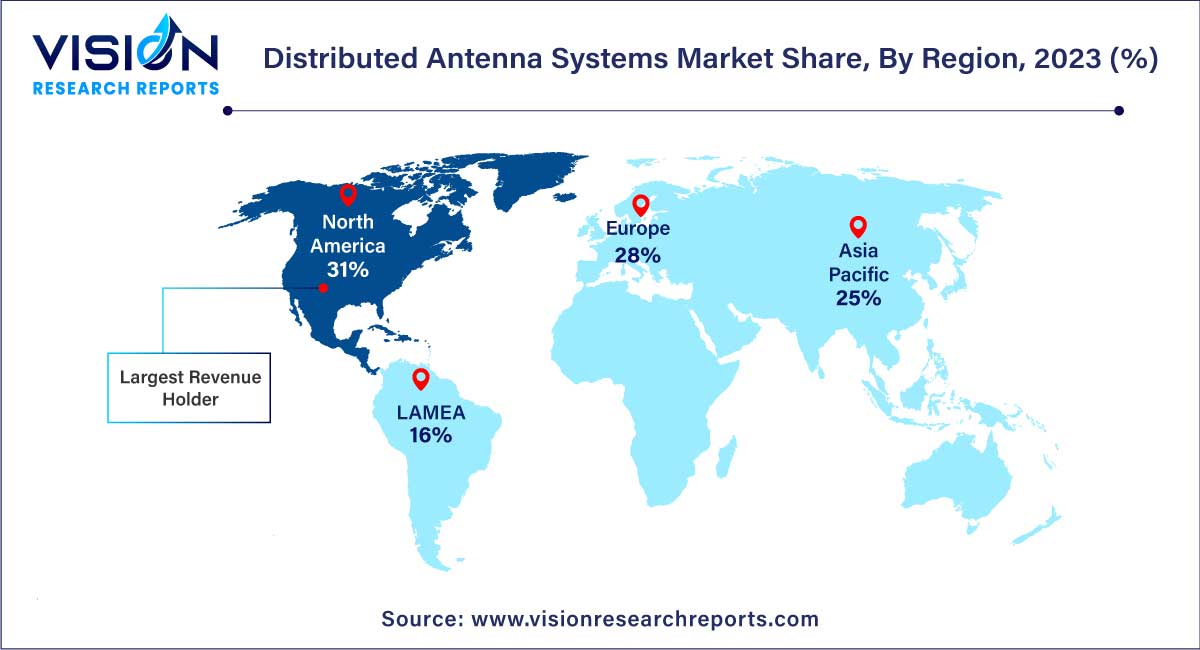
North America accounted for the largest market share of 31% in 2023. This growth is attributed to the rising trend of Bring Your Own Devices (BYOD) along with the development of smart cities. Additionally, the increasing use of smartphones and ever-growing wireless traffic is expected to drive regional expansion further. North America has been at the forefront of technological advancements in telecommunications, including wireless communication infrastructure. The region has seen early adoption and investment in DAS technology, allowing for widespread implementation and market dominance.

Asia Pacific is projected to demonstrate growth at the fastest CAGR of 12.17% over the forecast period. This growth is attributed to the increasing use of mobiles and tablets, rapid technological advancements, and the popularity of online streaming in emerging economies, such as China and India. Increasing infrastructural growth in India and China can be accredited to regional growth. Additionally, the rising deployment of 4G/LTE connections and the substantial presence of DAS providers further contribute to the growth. Therefore, deploying 4G/LTE technologies and infrastructural growth offers numerous opportunities for deploying the DAS solution.
CommScope announced in June 2023 that JTOWER, a neutral host service provider, had chosen them as a major partner. Through increased efficiency and connectivity for different operators, this cooperation aims to maximize the utilization of broadband resources, which will ultimately benefit end users by enhancing network performance and facilitating seamless access.
The Real Betis Balompié football team and Cellnex, a well-known supplier of television infrastructure and cellular telecommunications, partnered in December 2022. This partnership's main goal is to modernize the club's digital infrastructure and provide its loyal supporters with the best possible online experience. This revolutionary move heralds a new era of digital involvement within the football community and demonstrates Real Betis' dedication to adopting cutting-edge technologies and providing flawless connectivity for its followers.
By Technology
By Ownership
By Application
By Region
Chapter 1. Introduction
1.1. Research Objective
1.2. Scope of the Study
1.3. Definition
Chapter 2. Research Methodology
2.1. Research Approach
2.2. Data Sources
2.3. Assumptions & Limitations
Chapter 3. Executive Summary
3.1. Market Snapshot
Chapter 4. Market Variables and Scope
4.1. Introduction
4.2. Market Classification and Scope
4.3. Industry Value Chain Analysis
4.3.1. Raw Material Procurement Analysis
4.3.2. Sales and Distribution Technology Analysis
4.3.3. Downstream Buyer Analysis
Chapter 5. COVID 19 Impact on Distributed Antenna Systems Market
5.1. COVID-19 Landscape: Distributed Antenna Systems Industry Impact
5.2. COVID 19 - Impact Assessment for the Industry
5.3. COVID 19 Impact: Global Major Government Policy
5.4. Market Trends and Opportunities in the COVID-19 Landscape
Chapter 6. Market Dynamics Analysis and Trends
6.1. Market Dynamics
6.1.1. Market Drivers
6.1.2. Market Restraints
6.1.3. Market Opportunities
6.2. Porter’s Five Forces Analysis
6.2.1. Bargaining power of suppliers
6.2.2. Bargaining power of buyers
6.2.3. Threat of substitute
6.2.4. Threat of new entrants
6.2.5. Degree of competition
Chapter 7. Competitive Landscape
7.1.1. Company Market Share/Positioning Analysis
7.1.2. Key Strategies Adopted by Players
7.1.3. Vendor Landscape
7.1.3.1. List of Suppliers
7.1.3.2. List of Buyers
Chapter 8. Global Distributed Antenna Systems Market, By Technology
8.1. Distributed Antenna Systems Market, by Technology, 2024-2033
8.1.1 Active DAS
8.1.1.1. Market Revenue and Forecast (2021-2033)
8.1.2. Hybrid DAS
8.1.2.1. Market Revenue and Forecast (2021-2033)
8.1.3. Passive DAS
8.1.3.1. Market Revenue and Forecast (2021-2033)
Chapter 9. Global Distributed Antenna Systems Market, By Ownership
9.1. Distributed Antenna Systems Market, by Ownership, 2024-2033
9.1.1. Carrier Ownership
9.1.1.1. Market Revenue and Forecast (2021-2033)
9.1.2. Neutral-host Ownership
9.1.2.1. Market Revenue and Forecast (2021-2033)
9.1.3. Enterprise Ownership
9.1.3.1. Market Revenue and Forecast (2021-2033)
Chapter 10. Global Distributed Antenna Systems Market, By Application
10.1. Distributed Antenna Systems Market, by Application, 2024-2033
10.1.1. Public Venues & Safety
10.1.1.1. Market Revenue and Forecast (2021-2033)
10.1.2. Hospitality
10.1.2.1. Market Revenue and Forecast (2021-2033)
10.1.3. Airport & Transportation
10.1.3.1. Market Revenue and Forecast (2021-2033)
10.1.4. Healthcare
10.1.4.1. Market Revenue and Forecast (2021-2033)
10.1.5. Education Sector & Corporate Offices
10.1.5.1. Market Revenue and Forecast (2021-2033)
10.1.6. Industrial
10.1.6.1. Market Revenue and Forecast (2021-2033)
10.1.7. Other
10.1.7.1. Market Revenue and Forecast (2021-2033)
Chapter 11. Global Distributed Antenna Systems Market, Regional Estimates and Trend Forecast
11.1. North America
11.1.1. Market Revenue and Forecast, by Technology (2021-2033)
11.1.2. Market Revenue and Forecast, by Ownership (2021-2033)
11.1.3. Market Revenue and Forecast, by Application (2021-2033)
11.1.4. U.S.
11.1.4.1. Market Revenue and Forecast, by Technology (2021-2033)
11.1.4.2. Market Revenue and Forecast, by Ownership (2021-2033)
11.1.4.3. Market Revenue and Forecast, by Application (2021-2033)
11.1.5. Rest of North America
11.1.5.1. Market Revenue and Forecast, by Technology (2021-2033)
11.1.5.2. Market Revenue and Forecast, by Ownership (2021-2033)
11.1.5.3. Market Revenue and Forecast, by Application (2021-2033)
11.2. Europe
11.2.1. Market Revenue and Forecast, by Technology (2021-2033)
11.2.2. Market Revenue and Forecast, by Ownership (2021-2033)
11.2.3. Market Revenue and Forecast, by Application (2021-2033)
11.2.4. UK
11.2.4.1. Market Revenue and Forecast, by Technology (2021-2033)
11.2.4.2. Market Revenue and Forecast, by Ownership (2021-2033)
11.2.4.3. Market Revenue and Forecast, by Application (2021-2033)
11.2.5. Germany
11.2.5.1. Market Revenue and Forecast, by Technology (2021-2033)
11.2.5.2. Market Revenue and Forecast, by Ownership (2021-2033)
11.2.5.3. Market Revenue and Forecast, by Application (2021-2033)
11.2.6. France
11.2.6.1. Market Revenue and Forecast, by Technology (2021-2033)
11.2.6.2. Market Revenue and Forecast, by Ownership (2021-2033)
11.2.6.3. Market Revenue and Forecast, by Application (2021-2033)
11.2.7. Rest of Europe
11.2.7.1. Market Revenue and Forecast, by Technology (2021-2033)
11.2.7.2. Market Revenue and Forecast, by Ownership (2021-2033)
11.2.7.3. Market Revenue and Forecast, by Application (2021-2033)
11.3. APAC
11.3.1. Market Revenue and Forecast, by Technology (2021-2033)
11.3.2. Market Revenue and Forecast, by Ownership (2021-2033)
11.3.3. Market Revenue and Forecast, by Application (2021-2033)
11.3.4. India
11.3.4.1. Market Revenue and Forecast, by Technology (2021-2033)
11.3.4.2. Market Revenue and Forecast, by Ownership (2021-2033)
11.3.4.3. Market Revenue and Forecast, by Application (2021-2033)
11.3.5. China
11.3.5.1. Market Revenue and Forecast, by Technology (2021-2033)
11.3.5.2. Market Revenue and Forecast, by Ownership (2021-2033)
11.3.5.3. Market Revenue and Forecast, by Application (2021-2033)
11.3.6. Japan
11.3.6.1. Market Revenue and Forecast, by Technology (2021-2033)
11.3.6.2. Market Revenue and Forecast, by Ownership (2021-2033)
11.3.6.3. Market Revenue and Forecast, by Application (2021-2033)
11.3.7. Rest of APAC
11.3.7.1. Market Revenue and Forecast, by Technology (2021-2033)
11.3.7.2. Market Revenue and Forecast, by Ownership (2021-2033)
11.3.7.3. Market Revenue and Forecast, by Application (2021-2033)
11.4. MEA
11.4.1. Market Revenue and Forecast, by Technology (2021-2033)
11.4.2. Market Revenue and Forecast, by Ownership (2021-2033)
11.4.3. Market Revenue and Forecast, by Application (2021-2033)
11.4.4. GCC
11.4.4.1. Market Revenue and Forecast, by Technology (2021-2033)
11.4.4.2. Market Revenue and Forecast, by Ownership (2021-2033)
11.4.4.3. Market Revenue and Forecast, by Application (2021-2033)
11.4.5. North Africa
11.4.5.1. Market Revenue and Forecast, by Technology (2021-2033)
11.4.5.2. Market Revenue and Forecast, by Ownership (2021-2033)
11.4.5.3. Market Revenue and Forecast, by Application (2021-2033)
11.4.6. South Africa
11.4.6.1. Market Revenue and Forecast, by Technology (2021-2033)
11.4.6.2. Market Revenue and Forecast, by Ownership (2021-2033)
11.4.6.3. Market Revenue and Forecast, by Application (2021-2033)
11.4.7. Rest of MEA
11.4.7.1. Market Revenue and Forecast, by Technology (2021-2033)
11.4.7.2. Market Revenue and Forecast, by Ownership (2021-2033)
11.4.7.3. Market Revenue and Forecast, by Application (2021-2033)
11.5. Latin America
11.5.1. Market Revenue and Forecast, by Technology (2021-2033)
11.5.2. Market Revenue and Forecast, by Ownership (2021-2033)
11.5.3. Market Revenue and Forecast, by Application (2021-2033)
11.5.4. Brazil
11.5.4.1. Market Revenue and Forecast, by Technology (2021-2033)
11.5.4.2. Market Revenue and Forecast, by Ownership (2021-2033)
11.5.4.3. Market Revenue and Forecast, by Application (2021-2033)
11.5.5. Rest of LATAM
11.5.5.1. Market Revenue and Forecast, by Technology (2021-2033)
11.5.5.2. Market Revenue and Forecast, by Ownership (2021-2033)
11.5.5.3. Market Revenue and Forecast, by Application (2021-2033)
Chapter 12. Company Profiles
12.1. COMMSCOPE.
12.1.1. Company Overview
12.1.2. Product Offerings
12.1.3. Financial Performance
12.1.4. Recent Initiatives
12.2. Cobham Limited.
12.2.1. Company Overview
12.2.2. Product Offerings
12.2.3. Financial Performance
12.2.4. Recent Initiatives
12.3. Corning Incorporated.
12.3.1. Company Overview
12.3.2. Product Offerings
12.3.3. Financial Performance
12.3.4. Recent Initiatives
12.4. TE Connectivity.
12.4.1. Company Overview
12.4.2. Product Offerings
12.4.3. Financial Performance
12.4.4. Recent Initiatives
12.5. Crown Castle.
12.5.1. Company Overview
12.5.2. Product Offerings
12.5.3. Financial Performance
12.5.4. Recent Initiatives
12.6. Boingo Wireless, Inc.
12.6.1. Company Overview
12.6.2. Product Offerings
12.6.3. Financial Performance
12.6.4. Recent Initiatives
12.7. Comba Telecom Systems Holdings Ltd.
12.7.1. Company Overview
12.7.2. Product Offerings
12.7.3. Financial Performance
12.7.4. Recent Initiatives
12.8. Comtech Technologies Inc.
12.8.1. Company Overview
12.8.2. Product Offerings
12.8.3. Financial Performance
12.8.4. Recent Initiatives
12.9. Westell Technologies, Inc.
12.9.1. Company Overview
12.9.2. Product Offerings
12.9.3. Financial Performance
12.9.4. Recent Initiatives
12.10. Dali Wireless
12.10.1. Company Overview
12.10.2. Product Offerings
12.10.3. Financial Performance
12.10.4. Recent Initiatives
Chapter 13. Research Methodology
13.1. Primary Research
13.2. Secondary Research
13.3. Assumptions
Chapter 14. Appendix
14.1. About Us
14.2. Glossary of Terms
 Cross-segment Market Size and Analysis for
Mentioned Segments
 Additional Company Profiles (Upto 5 With No Cost)
 Additional Countries (Apart From Mentioned Countries)
 Country/Region-specific Report
 Go To Market Strategy
 Region Specific Market Dynamics
 Region Level Market Share
 Import Export Analysis
 Production Analysis
 Others