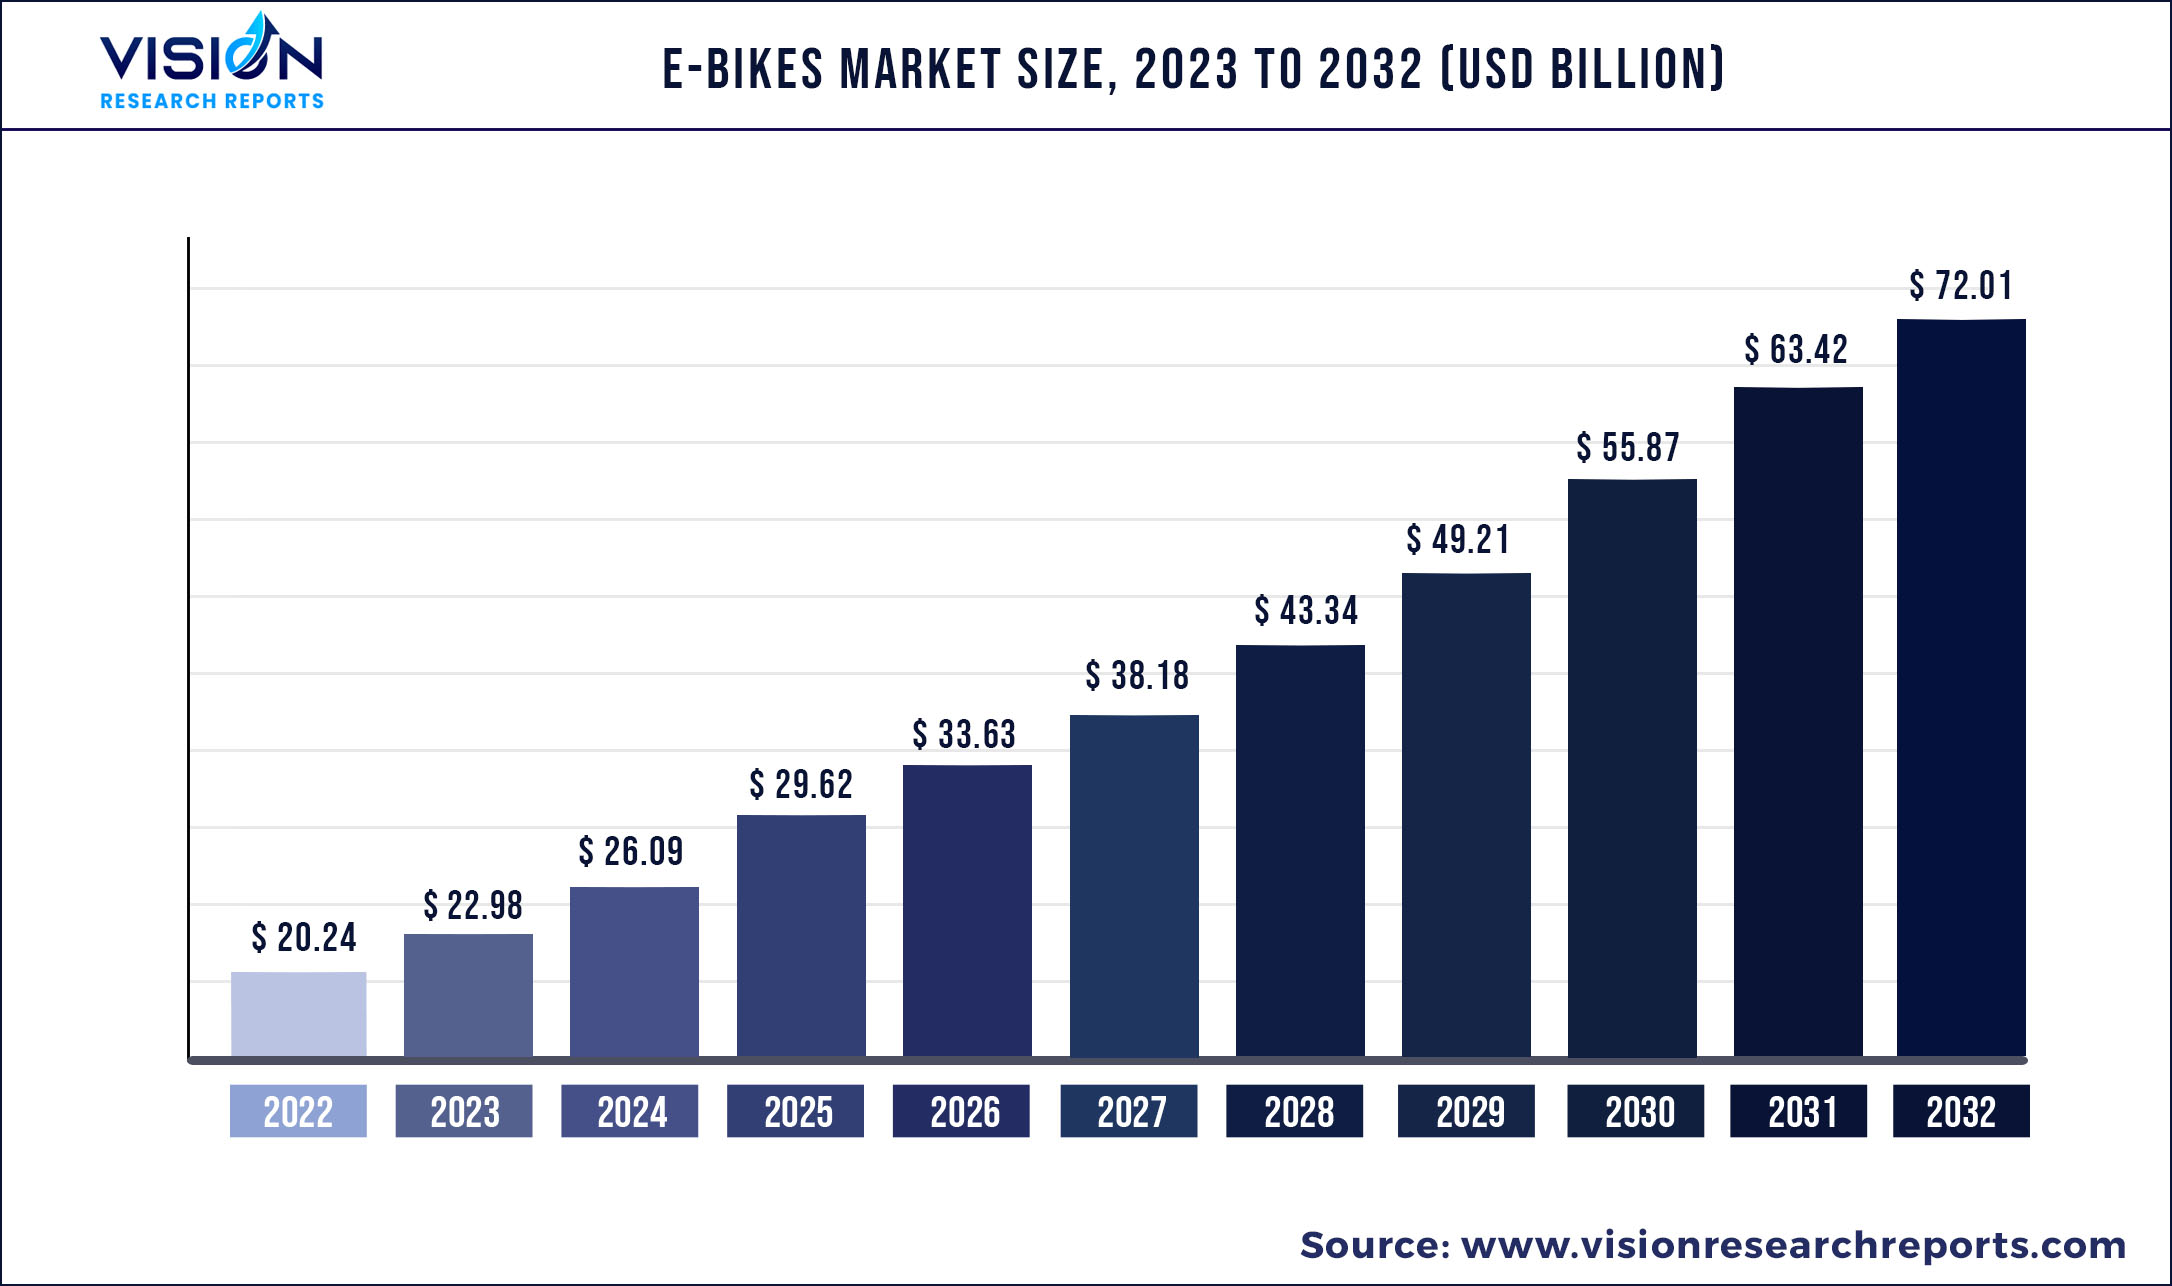
The global e-bikes market was valued at USD 20.24 billion in 2022 and it is predicted to surpass around USD 72.01 billion by 2032 with a CAGR of 13.53% from 2023 to 2032.
Key Pointers
Report Scope of the E-bikes Market
| Report Coverage | Details |
| Market Size in 2022 | USD 20.24 billion |
| Revenue Forecast by 2032 | USD 72.01 billion |
| Growth rate from 2023 to 2032 | CAGR of 13.53% |
| Base Year | 2022 |
| Forecast Period | 2023 to 2032 |
| Regions Covered | North America, Europe, Asia Pacific, Latin America, Middle East & Africa |
| Companies Covered | Yamaha Motor Company; Yadea Group Holdings Ltd.; Merida Industry Co. Ltd.; Pedego Electric Bikes |
Several governments are undertaking initiatives to mitigate carbon footprints by encouraging the use of electric vehicles, electric bikes, and bicycles. The increasing awareness about the harmful effects of vehicles that run on fossil fuels is also boosting this trend. Furthermore, governments are focused on constructing bicycle-friendly streets, thereby encouraging individuals to choose bicycles as their mode of transport.
The growing demand for e-bikes can also be attributed to the increasing technological advancements in the industry. For instance, connected e-bikes feature a SIM module that allows them to send and receive data through the cloud without a smartphone connection. These bikes also offer features such as remote diagnostics, integrated navigation, anti-theft systems, social media connectivity, and automatic emergency calls. Robert Bosch GmbH is a leading player in the industry that offers connected e-bikes.
During the first half of 2020, the market witnessed a significant decline in growth owing to the outbreak of the COVID-19 pandemic. Lockdowns were imposed across the globe, which resulted in the short-term closure of various manufacturing and assembly units. However, the increasing need to avoid the use of public transport during this time has encouraged individuals to opt for bicycles. As a result, the demand for e-bikes has increased significantly as an affordable, safe, and convenient mode of transport.
Electric bikes are a flexible, eco-friendly, and versatile mode of transport. Customers consider them as an ideal substitute for smart cars, public transport, and scooters. They help to minimize traffic congestion owing to their reduced form factor, provide greater speed with marginal effort, and offer various health benefits. These factors are expected to support the demand for e-bikes globally.
Regional Insights
The Asia Pacific held the largest revenue share of over 76.04% in 2022, owing to the increasing consumption expenditure in countries such as China and India. The Asia Pacific is undergoing numerous technological advancements along with ever-developing charging infrastructure. The region is characterized by the presence of numerous prominent players, such as Yadea Group Holdings Ltd., Yamaha Motor Company, and Aima Technology Group Co. Ltd. The rising demand for eco-friendly transportation and increasing government initiatives is anticipated to further drive the growth.
North America is anticipated to grow at the highest CAGR of 15.86% from 2023 to 2032. The rising number of manufacturing units and IT companies, coupled with the surging tech-savvy and urban population in the region, is expected to drive the growth of the regional market. Furthermore, the low cost of raw materials and availability of cheap labor in the region are likely to provide lucrative opportunities for the regional market.
E-bikes Market Segmentations:
| By Propulsion Type | By Battery Type | By Power | By Application |
|
Pedal-assisted Throttle-assisted |
Lithium-ion Battery Lead-acid Battery |
Less than or equal to 250W Above 250W |
City/Urban Trekking Cargo Others |
Chapter 1. Introduction
1.1. Research Objective
1.2. Scope of the Study
1.3. Definition
Chapter 2. Research Methodology
2.1. Research Approach
2.2. Data Sources
2.3. Assumptions & Limitations
Chapter 3. Executive Summary
3.1. Market Snapshot
Chapter 4. Market Variables and Scope
4.1. Introduction
4.2. Market Classification and Scope
4.3. Industry Value Chain Analysis
4.3.1. Raw Material Procurement Analysis
4.3.2. Sales and Distribution Channel Analysis
4.3.3. Downstream Buyer Analysis
Chapter 5. COVID 19 Impact on E-bikes Market
5.1. COVID-19 Landscape: E-bikes Industry Impact
5.2. COVID 19 - Impact Assessment for the Industry
5.3. COVID 19 Impact: Global Major Government Policy
5.4. Market Trends and Opportunities in the COVID-19 Landscape
Chapter 6. Market Dynamics Analysis and Trends
6.1. Market Dynamics
6.1.1. Market Drivers
6.1.2. Market Restraints
6.1.3. Market Opportunities
6.2. Porter’s Five Forces Analysis
6.2.1. Bargaining power of suppliers
6.2.2. Bargaining power of buyers
6.2.3. Threat of substitute
6.2.4. Threat of new entrants
6.2.5. Degree of competition
Chapter 7. Competitive Landscape
7.1.1. Company Market Share/Positioning Analysis
7.1.2. Key Strategies Adopted by Players
7.1.3. Vendor Landscape
7.1.3.1. List of Suppliers
7.1.3.2. List of Buyers
Chapter 8. Global E-bikes Market, By Propulsion Type
8.1. E-bikes Market, by Propulsion Type, 2023-2032
8.1.1. Pedal-assisted
8.1.1.1. Market Revenue and Forecast (2020-2032)
8.1.2. Throttle-assisted
8.1.2.1. Market Revenue and Forecast (2020-2032)
Chapter 9. Global E-bikes Market, By Battery Type
9.1. E-bikes Market, by Battery Type, 2023-2032
9.1.1. Lithium-ion Battery
9.1.1.1. Market Revenue and Forecast (2020-2032)
9.1.2. Lead-acid Battery
9.1.2.1. Market Revenue and Forecast (2020-2032)
Chapter 10. Global E-bikes Market, By Power
10.1. E-bikes Market, by Power, 2023-2032
10.1.1. Less than or equal to 250W
10.1.1.1. Market Revenue and Forecast (2020-2032)
10.1.2. Above 250W
10.1.2.1. Market Revenue and Forecast (2020-2032)
Chapter 11. Global E-bikes Market, By Application
11.1. E-bikes Market, by Application, 2023-2032
11.1.1. City/Urban
11.1.1.1. Market Revenue and Forecast (2020-2032)
11.1.2. Trekking
11.1.2.1. Market Revenue and Forecast (2020-2032)
11.1.3. Cargo
11.1.3.1. Market Revenue and Forecast (2020-2032)
11.1.4. Others
11.1.4.1. Market Revenue and Forecast (2020-2032)
Chapter 12. Global E-bikes Market, Regional Estimates and Trend Forecast
12.1. North America
12.1.1. Market Revenue and Forecast, by Propulsion Type (2020-2032)
12.1.2. Market Revenue and Forecast, by Battery Type (2020-2032)
12.1.3. Market Revenue and Forecast, by Power (2020-2032)
12.1.4. Market Revenue and Forecast, by Application (2020-2032)
12.1.5. U.S.
12.1.5.1. Market Revenue and Forecast, by Propulsion Type (2020-2032)
12.1.5.2. Market Revenue and Forecast, by Battery Type (2020-2032)
12.1.5.3. Market Revenue and Forecast, by Power (2020-2032)
12.1.5.4. Market Revenue and Forecast, by Application (2020-2032)
12.1.6. Rest of North America
12.1.6.1. Market Revenue and Forecast, by Propulsion Type (2020-2032)
12.1.6.2. Market Revenue and Forecast, by Battery Type (2020-2032)
12.1.6.3. Market Revenue and Forecast, by Power (2020-2032)
12.1.6.4. Market Revenue and Forecast, by Application (2020-2032)
12.2. Europe
12.2.1. Market Revenue and Forecast, by Propulsion Type (2020-2032)
12.2.2. Market Revenue and Forecast, by Battery Type (2020-2032)
12.2.3. Market Revenue and Forecast, by Power (2020-2032)
12.2.4. Market Revenue and Forecast, by Application (2020-2032)
12.2.5. UK
12.2.5.1. Market Revenue and Forecast, by Propulsion Type (2020-2032)
12.2.5.2. Market Revenue and Forecast, by Battery Type (2020-2032)
12.2.5.3. Market Revenue and Forecast, by Power (2020-2032)
12.2.5.4. Market Revenue and Forecast, by Application (2020-2032)
12.2.6. Germany
12.2.6.1. Market Revenue and Forecast, by Propulsion Type (2020-2032)
12.2.6.2. Market Revenue and Forecast, by Battery Type (2020-2032)
12.2.6.3. Market Revenue and Forecast, by Power (2020-2032)
12.2.6.4. Market Revenue and Forecast, by Application (2020-2032)
12.2.7. France
12.2.7.1. Market Revenue and Forecast, by Propulsion Type (2020-2032)
12.2.7.2. Market Revenue and Forecast, by Battery Type (2020-2032)
12.2.7.3. Market Revenue and Forecast, by Power (2020-2032)
12.2.7.4. Market Revenue and Forecast, by Application (2020-2032)
12.2.8. Rest of Europe
12.2.8.1. Market Revenue and Forecast, by Propulsion Type (2020-2032)
12.2.8.2. Market Revenue and Forecast, by Battery Type (2020-2032)
12.2.8.3. Market Revenue and Forecast, by Power (2020-2032)
12.2.8.4. Market Revenue and Forecast, by Application (2020-2032)
12.3. APAC
12.3.1. Market Revenue and Forecast, by Propulsion Type (2020-2032)
12.3.2. Market Revenue and Forecast, by Battery Type (2020-2032)
12.3.3. Market Revenue and Forecast, by Power (2020-2032)
12.3.4. Market Revenue and Forecast, by Application (2020-2032)
12.3.5. India
12.3.5.1. Market Revenue and Forecast, by Propulsion Type (2020-2032)
12.3.5.2. Market Revenue and Forecast, by Battery Type (2020-2032)
12.3.5.3. Market Revenue and Forecast, by Power (2020-2032)
12.3.5.4. Market Revenue and Forecast, by Application (2020-2032)
12.3.6. China
12.3.6.1. Market Revenue and Forecast, by Propulsion Type (2020-2032)
12.3.6.2. Market Revenue and Forecast, by Battery Type (2020-2032)
12.3.6.3. Market Revenue and Forecast, by Power (2020-2032)
12.3.6.4. Market Revenue and Forecast, by Application (2020-2032)
12.3.7. Japan
12.3.7.1. Market Revenue and Forecast, by Propulsion Type (2020-2032)
12.3.7.2. Market Revenue and Forecast, by Battery Type (2020-2032)
12.3.7.3. Market Revenue and Forecast, by Power (2020-2032)
12.3.7.4. Market Revenue and Forecast, by Application (2020-2032)
12.3.8. Rest of APAC
12.3.8.1. Market Revenue and Forecast, by Propulsion Type (2020-2032)
12.3.8.2. Market Revenue and Forecast, by Battery Type (2020-2032)
12.3.8.3. Market Revenue and Forecast, by Power (2020-2032)
12.3.8.4. Market Revenue and Forecast, by Application (2020-2032)
12.4. MEA
12.4.1. Market Revenue and Forecast, by Propulsion Type (2020-2032)
12.4.2. Market Revenue and Forecast, by Battery Type (2020-2032)
12.4.3. Market Revenue and Forecast, by Power (2020-2032)
12.4.4. Market Revenue and Forecast, by Application (2020-2032)
12.4.5. GCC
12.4.5.1. Market Revenue and Forecast, by Propulsion Type (2020-2032)
12.4.5.2. Market Revenue and Forecast, by Battery Type (2020-2032)
12.4.5.3. Market Revenue and Forecast, by Power (2020-2032)
12.4.5.4. Market Revenue and Forecast, by Application (2020-2032)
12.4.6. North Africa
12.4.6.1. Market Revenue and Forecast, by Propulsion Type (2020-2032)
12.4.6.2. Market Revenue and Forecast, by Battery Type (2020-2032)
12.4.6.3. Market Revenue and Forecast, by Power (2020-2032)
12.4.6.4. Market Revenue and Forecast, by Application (2020-2032)
12.4.7. South Africa
12.4.7.1. Market Revenue and Forecast, by Propulsion Type (2020-2032)
12.4.7.2. Market Revenue and Forecast, by Battery Type (2020-2032)
12.4.7.3. Market Revenue and Forecast, by Power (2020-2032)
12.4.7.4. Market Revenue and Forecast, by Application (2020-2032)
12.4.8. Rest of MEA
12.4.8.1. Market Revenue and Forecast, by Propulsion Type (2020-2032)
12.4.8.2. Market Revenue and Forecast, by Battery Type (2020-2032)
12.4.8.3. Market Revenue and Forecast, by Power (2020-2032)
12.4.8.4. Market Revenue and Forecast, by Application (2020-2032)
12.5. Latin America
12.5.1. Market Revenue and Forecast, by Propulsion Type (2020-2032)
12.5.2. Market Revenue and Forecast, by Battery Type (2020-2032)
12.5.3. Market Revenue and Forecast, by Power (2020-2032)
12.5.4. Market Revenue and Forecast, by Application (2020-2032)
12.5.5. Brazil
12.5.5.1. Market Revenue and Forecast, by Propulsion Type (2020-2032)
12.5.5.2. Market Revenue and Forecast, by Battery Type (2020-2032)
12.5.5.3. Market Revenue and Forecast, by Power (2020-2032)
12.5.5.4. Market Revenue and Forecast, by Application (2020-2032)
12.5.6. Rest of LATAM
12.5.6.1. Market Revenue and Forecast, by Propulsion Type (2020-2032)
12.5.6.2. Market Revenue and Forecast, by Battery Type (2020-2032)
12.5.6.3. Market Revenue and Forecast, by Power (2020-2032)
12.5.6.4. Market Revenue and Forecast, by Application (2020-2032)
Chapter 13. Company Profiles
13.1. Yamaha Motor Company
13.1.1. Company Overview
13.1.2. Product Offerings
13.1.3. Financial Performance
13.1.4. Recent Initiatives
13.2. Yadea Group Holdings Ltd.
13.2.1. Company Overview
13.2.2. Product Offerings
13.2.3. Financial Performance
13.2.4. Recent Initiatives
13.3. Merida Industry Co. Ltd.
13.3.1. Company Overview
13.3.2. Product Offerings
13.3.3. Financial Performance
13.3.4. Recent Initiatives
13.4. Pedego Electric Bikes
13.4.1. Company Overview
13.4.2. Product Offerings
13.4.3. Financial Performance
13.4.4. Recent Initiatives
Chapter 14. Research Methodology
14.1. Primary Research
14.2. Secondary Research
14.3. Assumptions
Chapter 15. Appendix
15.1. About Us
15.2. Glossary of Terms
 Cross-segment Market Size and Analysis for
Mentioned Segments
Additional Company Profiles (Upto 5 With No Cost)
Additional Countries (Apart From Mentioned Countries)
Country/Region-specific Report
Go To Market Strategy
Region Specific Market DynamicsRegion Level Market Share Import Export AnalysisProduction AnalysisOthers
Cross-segment Market Size and Analysis for
Mentioned Segments
Additional Company Profiles (Upto 5 With No Cost)
Additional Countries (Apart From Mentioned Countries)
Country/Region-specific Report
Go To Market Strategy
Region Specific Market DynamicsRegion Level Market Share Import Export AnalysisProduction AnalysisOthers