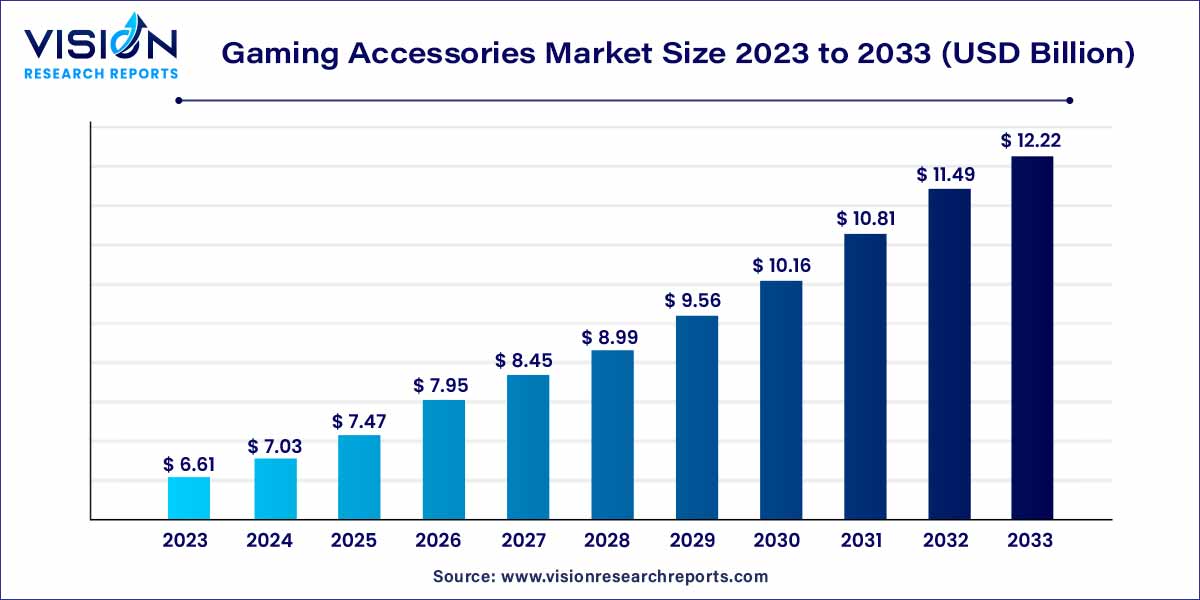
The global gaming accessories market size was estimated at around USD 6.61 billion in 2023 and it is projected to hit around USD 12.22 billion by 2033, growing at a CAGR of 6.34% from 2024 to 2033. The gaming accessories market is driven by the advent of virtual reality (VR) and augmented reality (AR) technologies, customization and aesthetics, increasing disposable income, and expanding gaming platforms.

The gaming industry has witnessed an unprecedented surge in popularity, and with it, the demand for gaming accessories has skyrocketed. This overview delves into the dynamic landscape of the gaming accessories market, examining key trends, factors driving growth, and the evolving consumer preferences that shape this burgeoning industry.
The gaming accessories market is experiencing robust growth driven by several key factors. One significant catalyst is the continuous evolution of technology within the gaming industry. As gaming hardware becomes increasingly sophisticated, the demand for cutting-edge accessories such as advanced controllers, high-performance keyboards, and precision mice continues to rise, enhancing the overall gaming experience. Another pivotal factor contributing to market growth is the surge in popularity of esports. The competitive gaming scene has created a demand for specialized gaming peripherals, attracting both professional gamers and enthusiasts seeking a competitive edge. Additionally, the integration of virtual reality (VR) and augmented reality (AR) technologies has led to the development of accessories that elevate the immersive aspects of gaming. These technological advancements, coupled with increasing disposable incomes among gamers, the social nature of gaming activities, and the expanding availability of gaming across various platforms, collectively drive the sustained growth of the gaming accessories market. Manufacturers and developers, adapting to emerging trends, play a crucial role in providing innovative tools that cater to the diverse needs of the growing gaming community.
| Report Coverage | Details |
| Growth Rate from 2024 to 2033 | CAGR of 6.34% |
| Market Revenue by 2033 | USD 12.22 billion |
| Revenue Share of North America in 2023 | 53% |
| Base Year | 2023 |
| Forecast Period | 2024 to 2033 |
| Market Analysis (Terms Used) | Value (US$ Million/Billion) or (Volume/Units) |
In terms of product, controllers dominated the global market with the largest market share of 33% in 2023. Controllers have a broad appeal across different gaming platforms. Whether used with gaming consoles, PCs, or even mobile devices, they provide a familiar and standardized means of interaction for gamers. This universality contributes to their widespread adoption and ensures they cater to a diverse audience, encompassing casual gamers, enthusiasts, and professional players.
PC gaming segment held 39% of the total market in 2023. Unlike consoles, PCs allow users to build and upgrade their gaming setups according to their preferences and requirements. This flexibility extends to gaming accessories such as keyboards, mice, headsets, and monitors, allowing gamers to create a personalized gaming environment. As a result, the demand for different accessories tailored to PC gaming has significantly contributed to the platform's market share.
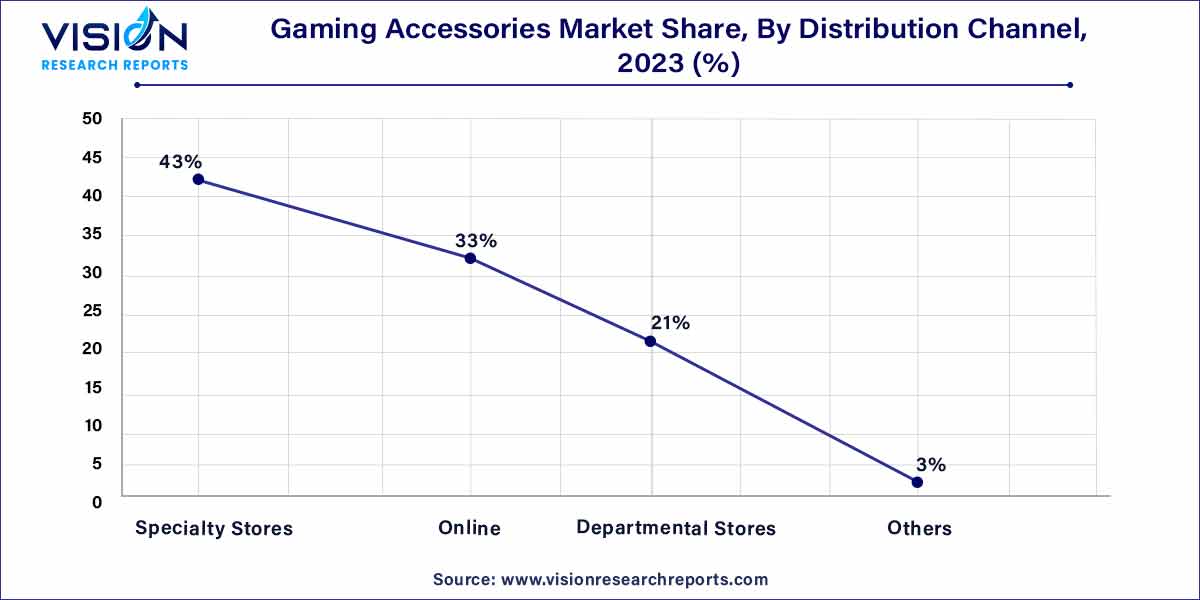
Specialty stores segment are expected to hold a market share of 43% in 2023. A focused and curated selection of gaming accessories in specialty stores is responsible for its prominence in the market. These stores specialize exclusively in gaming-related products, creating an environment where consumers can find various accessories tailored specifically for gaming purposes. This specialization allows for a more in-depth and knowledgeable approach to product offerings, catering to the unique requirements of gamers in terms of performance, design, and compatibility.

Specialty stores also excel in creating an immersive and engaging shopping experience for gamers. The ambiance of these stores is designed to resonate with gaming culture, fostering a sense of community and excitement. This environment attracts gaming enthusiasts and enhances the shopping experience, making it more enjoyable and memorable for consumers.
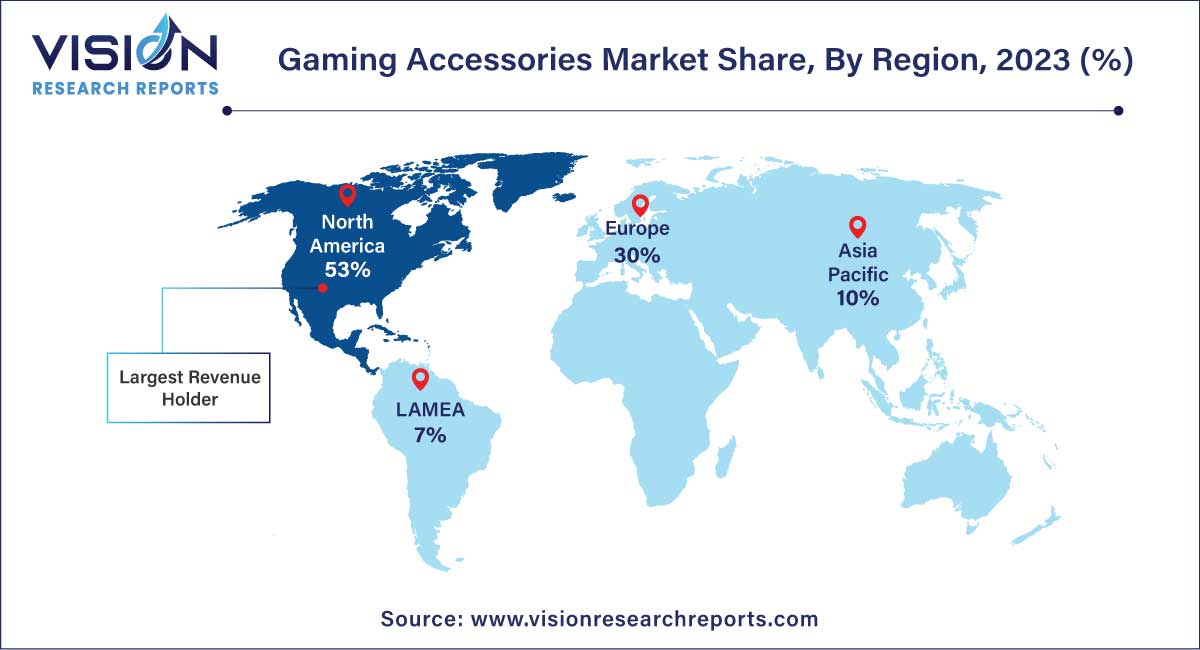
North America dominated the market with a share of 53% in 2023. The region boasts a large and diverse community of gamers, from casual players to professional esports enthusiasts. The widespread popularity of gaming as a form of entertainment has created a substantial market for high-quality accessories, including controllers, keyboards, headsets, and virtual reality peripherals.

Technological advancements in the gaming industry further solidify North America's leading position in the market. The region is home to leading gaming console manufacturers like Microsoft, Sony, and influential gaming accessory brands. The continuous innovation in gaming technology, including the development of advanced graphics, immersive audio, and cutting-edge peripherals, contributes to a high demand for top-tier accessories that complement these technological advancements.
By Product
By Platform
By Distribution
By Region
Chapter 1. Introduction
1.1. Research Objective
1.2. Scope of the Study
1.3. Definition
Chapter 2. Research Methodology
2.1. Research Approach
2.2. Data Sources
2.3. Assumptions & Limitations
Chapter 3. Executive Summary
3.1. Market Snapshot
Chapter 4. Market Variables and Scope
4.1. Introduction
4.2. Market Classification and Scope
4.3. Industry Value Chain Analysis
4.3.1. Raw Material Procurement Analysis
4.3.2. Sales and Distribution Product Analysis
4.3.3. Downstream Buyer Analysis
Chapter 5. COVID 19 Impact on Gaming Accessories Market
5.1. COVID-19 Landscape: Gaming Accessories Industry Impact
5.2. COVID 19 - Impact Assessment for the Industry
5.3. COVID 19 Impact: Global Major Government Policy
5.4. Market Trends and Opportunities in the COVID-19 Landscape
Chapter 6. Market Dynamics Analysis and Trends
6.1. Market Dynamics
6.1.1. Market Drivers
6.1.2. Market Restraints
6.1.3. Market Opportunities
6.2. Porter’s Five Forces Analysis
6.2.1. Bargaining power of suppliers
6.2.2. Bargaining power of buyers
6.2.3. Threat of substitute
6.2.4. Threat of new entrants
6.2.5. Degree of competition
Chapter 7. Competitive Landscape
7.1.1. Company Market Share/Positioning Analysis
7.1.2. Key Strategies Adopted by Players
7.1.3. Vendor Landscape
7.1.3.1. List of Suppliers
7.1.3.2. List of Buyers
Chapter 8. Global Gaming Accessories Market, By Product
8.1. Gaming Accessories Market, by Product, 2024-2033
8.1.1 Gaming Chairs
8.1.1.1. Market Revenue and Forecast (2021-2033)
8.1.2. Controllers
8.1.2.1. Market Revenue and Forecast (2021-2033)
8.1.3. Headsets and Audio Equipment
8.1.3.1. Market Revenue and Forecast (2021-2033)
8.1.4. Keyboards and Mouse
8.1.4.1. Market Revenue and Forecast (2021-2033)
8.1.5. Others
8.1.5.1. Market Revenue and Forecast (2021-2033)
Chapter 9. Global Gaming Accessories Market, By Platform
9.1. Gaming Accessories Market, by Platform, 2024-2033
9.1.1. Mobile
9.1.1.1. Market Revenue and Forecast (2021-2033)
9.1.2. Console
9.1.2.1. Market Revenue and Forecast (2021-2033)
9.1.3. PC Gaming
9.1.3.1. Market Revenue and Forecast (2021-2033)
Chapter 10. Global Gaming Accessories Market, By Distribution
10.1. Gaming Accessories Market, by Distribution, 2024-2033
10.1.1. Specialty Stores
10.1.1.1. Market Revenue and Forecast (2021-2033)
10.1.2. Online
10.1.2.1. Market Revenue and Forecast (2021-2033)
10.1.3. Departmental Stores
10.1.3.1. Market Revenue and Forecast (2021-2033)
10.1.4. Others
10.1.4.1. Market Revenue and Forecast (2021-2033)
Chapter 11. Global Gaming Accessories Market, Regional Estimates and Trend Forecast
11.1. North America
11.1.1. Market Revenue and Forecast, by Product (2021-2033)
11.1.2. Market Revenue and Forecast, by Platform (2021-2033)
11.1.3. Market Revenue and Forecast, by Distribution (2021-2033)
11.1.4. U.S.
11.1.4.1. Market Revenue and Forecast, by Product (2021-2033)
11.1.4.2. Market Revenue and Forecast, by Platform (2021-2033)
11.1.4.3. Market Revenue and Forecast, by Distribution (2021-2033)
11.1.5. Rest of North America
11.1.5.1. Market Revenue and Forecast, by Product (2021-2033)
11.1.5.2. Market Revenue and Forecast, by Platform (2021-2033)
11.1.5.3. Market Revenue and Forecast, by Distribution (2021-2033)
11.2. Europe
11.2.1. Market Revenue and Forecast, by Product (2021-2033)
11.2.2. Market Revenue and Forecast, by Platform (2021-2033)
11.2.3. Market Revenue and Forecast, by Distribution (2021-2033)
11.2.4. UK
11.2.4.1. Market Revenue and Forecast, by Product (2021-2033)
11.2.4.2. Market Revenue and Forecast, by Platform (2021-2033)
11.2.4.3. Market Revenue and Forecast, by Distribution (2021-2033)
11.2.5. Germany
11.2.5.1. Market Revenue and Forecast, by Product (2021-2033)
11.2.5.2. Market Revenue and Forecast, by Platform (2021-2033)
11.2.5.3. Market Revenue and Forecast, by Distribution (2021-2033)
11.2.6. France
11.2.6.1. Market Revenue and Forecast, by Product (2021-2033)
11.2.6.2. Market Revenue and Forecast, by Platform (2021-2033)
11.2.6.3. Market Revenue and Forecast, by Distribution (2021-2033)
11.2.7. Rest of Europe
11.2.7.1. Market Revenue and Forecast, by Product (2021-2033)
11.2.7.2. Market Revenue and Forecast, by Platform (2021-2033)
11.2.7.3. Market Revenue and Forecast, by Distribution (2021-2033)
11.3. APAC
11.3.1. Market Revenue and Forecast, by Product (2021-2033)
11.3.2. Market Revenue and Forecast, by Platform (2021-2033)
11.3.3. Market Revenue and Forecast, by Distribution (2021-2033)
11.3.4. India
11.3.4.1. Market Revenue and Forecast, by Product (2021-2033)
11.3.4.2. Market Revenue and Forecast, by Platform (2021-2033)
11.3.4.3. Market Revenue and Forecast, by Distribution (2021-2033)
11.3.5. China
11.3.5.1. Market Revenue and Forecast, by Product (2021-2033)
11.3.5.2. Market Revenue and Forecast, by Platform (2021-2033)
11.3.5.3. Market Revenue and Forecast, by Distribution (2021-2033)
11.3.6. Japan
11.3.6.1. Market Revenue and Forecast, by Product (2021-2033)
11.3.6.2. Market Revenue and Forecast, by Platform (2021-2033)
11.3.6.3. Market Revenue and Forecast, by Distribution (2021-2033)
11.3.7. Rest of APAC
11.3.7.1. Market Revenue and Forecast, by Product (2021-2033)
11.3.7.2. Market Revenue and Forecast, by Platform (2021-2033)
11.3.7.3. Market Revenue and Forecast, by Distribution (2021-2033)
11.4. MEA
11.4.1. Market Revenue and Forecast, by Product (2021-2033)
11.4.2. Market Revenue and Forecast, by Platform (2021-2033)
11.4.3. Market Revenue and Forecast, by Distribution (2021-2033)
11.4.4. GCC
11.4.4.1. Market Revenue and Forecast, by Product (2021-2033)
11.4.4.2. Market Revenue and Forecast, by Platform (2021-2033)
11.4.4.3. Market Revenue and Forecast, by Distribution (2021-2033)
11.4.5. North Africa
11.4.5.1. Market Revenue and Forecast, by Product (2021-2033)
11.4.5.2. Market Revenue and Forecast, by Platform (2021-2033)
11.4.5.3. Market Revenue and Forecast, by Distribution (2021-2033)
11.4.6. South Africa
11.4.6.1. Market Revenue and Forecast, by Product (2021-2033)
11.4.6.2. Market Revenue and Forecast, by Platform (2021-2033)
11.4.6.3. Market Revenue and Forecast, by Distribution (2021-2033)
11.4.7. Rest of MEA
11.4.7.1. Market Revenue and Forecast, by Product (2021-2033)
11.4.7.2. Market Revenue and Forecast, by Platform (2021-2033)
11.4.7.3. Market Revenue and Forecast, by Distribution (2021-2033)
11.5. Latin America
11.5.1. Market Revenue and Forecast, by Product (2021-2033)
11.5.2. Market Revenue and Forecast, by Platform (2021-2033)
11.5.3. Market Revenue and Forecast, by Distribution (2021-2033)
11.5.4. Brazil
11.5.4.1. Market Revenue and Forecast, by Product (2021-2033)
11.5.4.2. Market Revenue and Forecast, by Platform (2021-2033)
11.5.4.3. Market Revenue and Forecast, by Distribution (2021-2033)
11.5.5. Rest of LATAM
11.5.5.1. Market Revenue and Forecast, by Product (2021-2033)
11.5.5.2. Market Revenue and Forecast, by Platform (2021-2033)
11.5.5.3. Market Revenue and Forecast, by Distribution (2021-2033)
Chapter 12. Company Profiles
12.1. Logitech G.
12.1.1. Company Overview
12.1.2. Product Offerings
12.1.3. Financial Performance
12.1.4. Recent Initiatives
12.2. Razer Inc.
12.2.1. Company Overview
12.2.2. Product Offerings
12.2.3. Financial Performance
12.2.4. Recent Initiatives
12.3. Corsair.
12.3.1. Company Overview
12.3.2. Product Offerings
12.3.3. Financial Performance
12.3.4. Recent Initiatives
12.4. SteelSeries.
12.4.1. Company Overview
12.4.2. Product Offerings
12.4.3. Financial Performance
12.4.4. Recent Initiatives
12.5. HyperX.
12.5.1. Company Overview
12.5.2. Product Offerings
12.5.3. Financial Performance
12.5.4. Recent Initiatives
12.6. Thrustmaster
12.6.1. Company Overview
12.6.2. Product Offerings
12.6.3. Financial Performance
12.6.4. Recent Initiatives
12.7. Turtle Beach.
12.7.1. Company Overview
12.7.2. Product Offerings
12.7.3. Financial Performance
12.7.4. Recent Initiatives
12.8. ASUS
12.8.1. Company Overview
12.8.2. Product Offerings
12.8.3. Financial Performance
12.8.4. Recent Initiatives
12.9. Xbox.
12.9.1. Company Overview
12.9.2. Product Offerings
12.9.3. Financial Performance
12.9.4. Recent Initiatives
12.10. Micro-Star INT'L CO., LTD
12.10.1. Company Overview
12.10.2. Product Offerings
12.10.3. Financial Performance
12.10.4. Recent Initiatives
Chapter 13. Research Methodology
13.1. Primary Research
13.2. Secondary Research
13.3. Assumptions
Chapter 14. Appendix
14.1. About Us
14.2. Glossary of Terms
 Cross-segment Market Size and Analysis for
Mentioned Segments
 Additional Company Profiles (Upto 5 With No Cost)
 Additional Countries (Apart From Mentioned Countries)
 Country/Region-specific Report
 Go To Market Strategy
 Region Specific Market Dynamics
 Region Level Market Share
 Import Export Analysis
 Production Analysis
 Others