Internet of Things in Healthcare Market Size, Share | Report 2023-2032
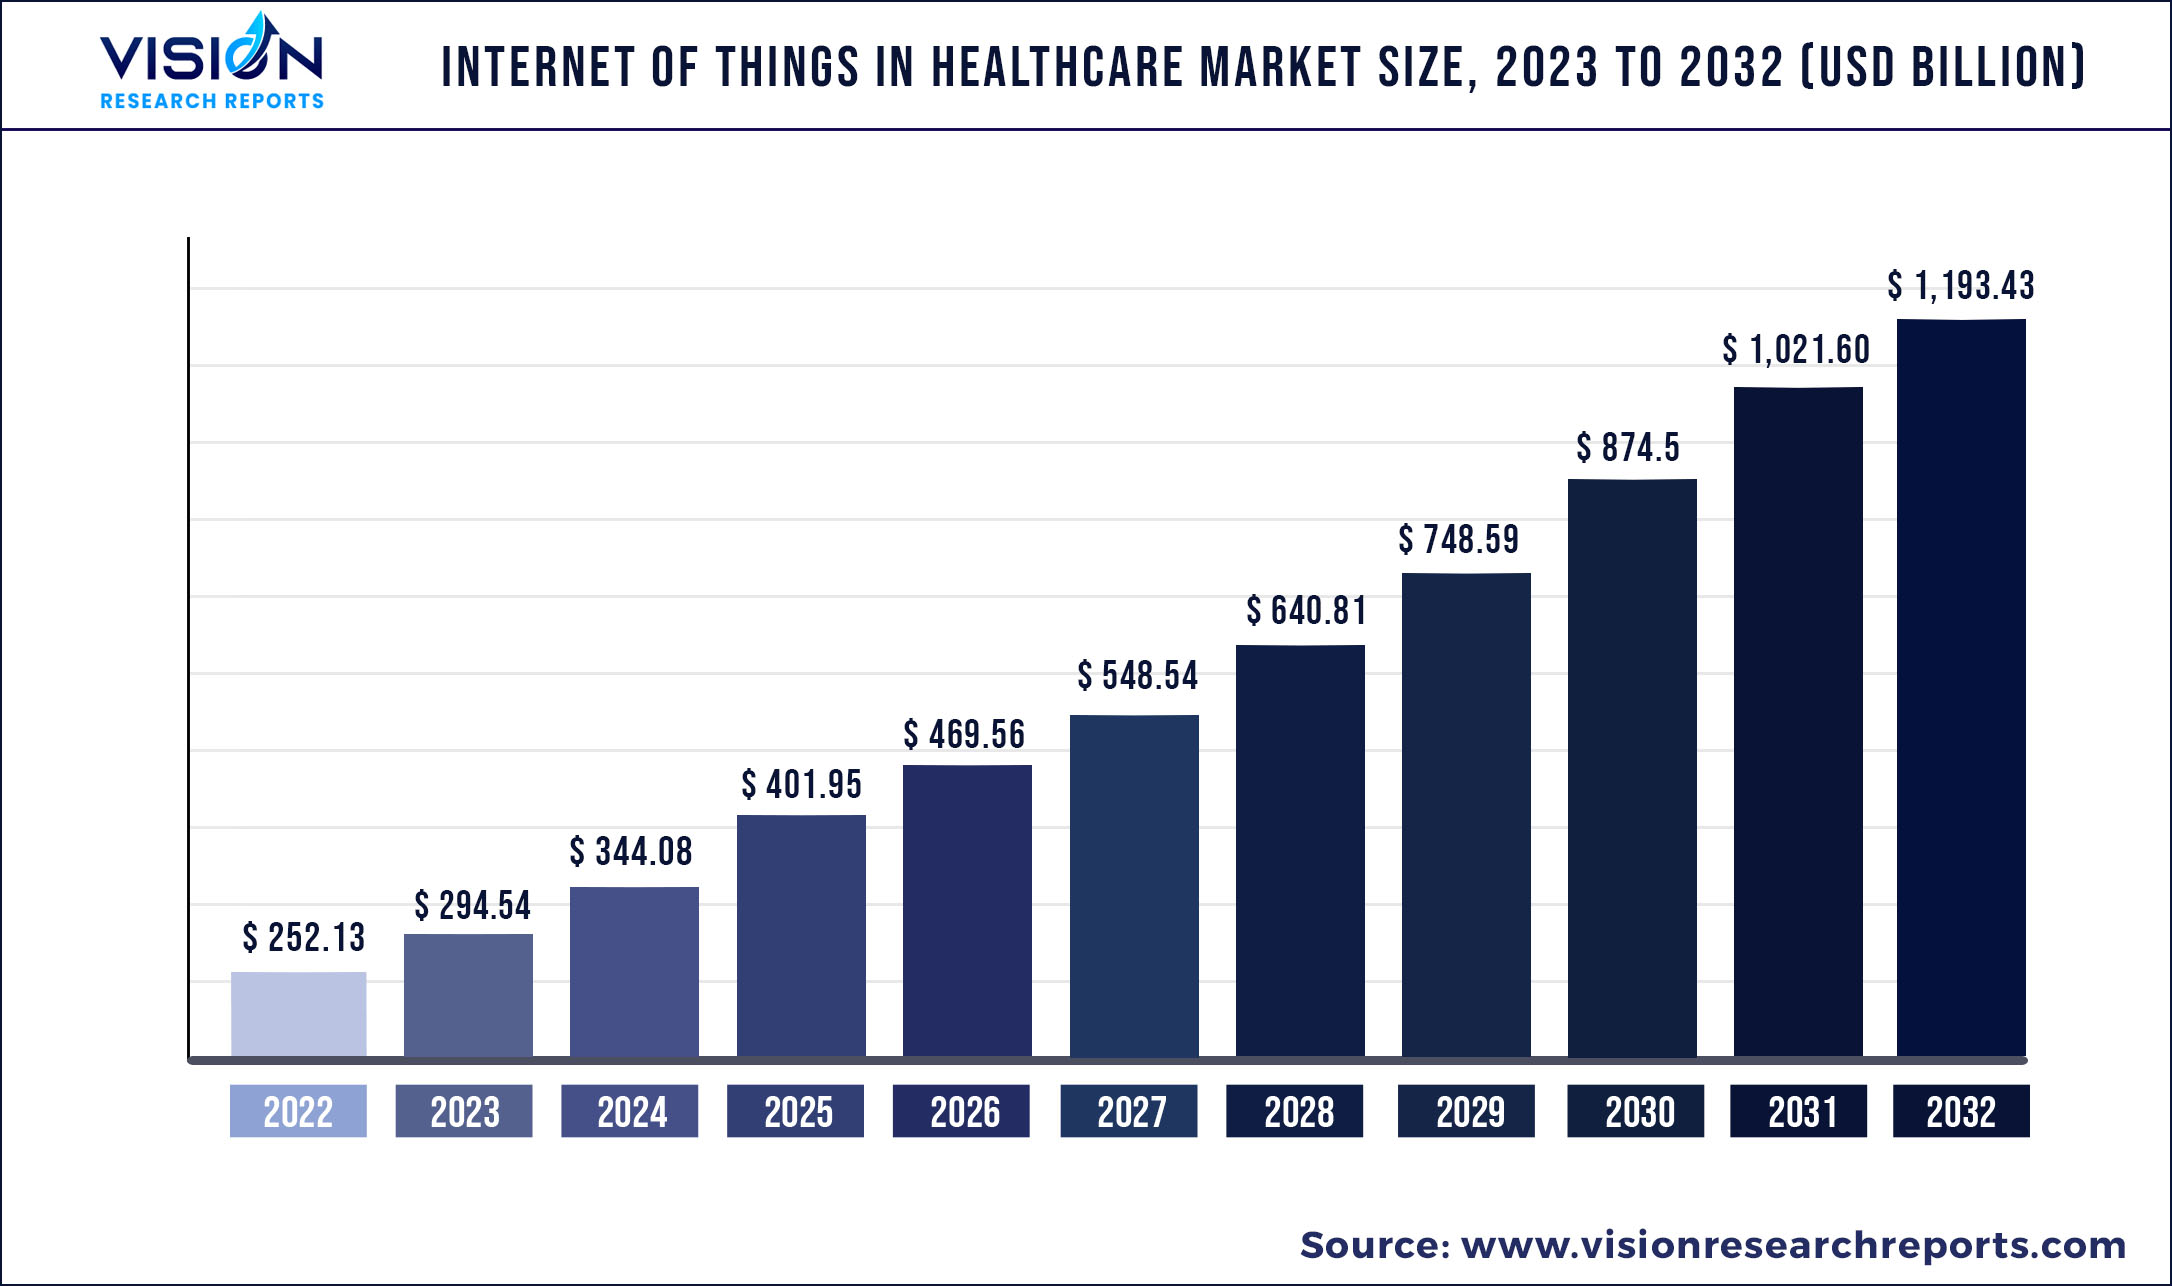
The global internet of things in healthcare market was surpassed at USD 252.13 billion in 2022 and is expected to hit around USD 1,193.43 billion by 2032, growing at a CAGR of 16.82% from 2023 to 2032.
Key Pointers
Report Scope of the Internet of Things in Healthcare Market
| Report Coverage | Details |
| Market Size in 2022 | USD 252.13 billion |
| Revenue Forecast by 2032 | USD 1,193.43 billion |
| Growth rate from 2023 to 2032 | CAGR of 16.82% |
| Base Year | 2022 |
| Forecast Period | 2023 to 2032 |
| Market Analysis (Terms Used) | Value (US$ Million/Billion) or (Volume/Units) |
| Regions Covered | North America, Europe, Asia Pacific, Latin America, Middle East & Africa |
| Companies Covered | Medtronic; Cisco Systems; Inc.; IBM Corporation; GE Healthcare; Microsoft Corporation; SAP SE; Infosys Limited; Cerner Corporation; QUALCOMM Incorporated; Amazon; Intel corporation; Wipro ltd |
The market is driven by the increasing usage of smartphones, smart devices, and wearables to monitor patients. Also, the increasing adoption of remote patient monitoring for improved out-of-hospital care boosts the market. Along with this, rising investments in implementing digital technologies in healthcare institutions, and the emergence of connected care are the key factors boosting industry growth. Technological advancements and the growing geriatric population coupled with the rising prevalence of chronic conditions are also positively impacting the market expansion.
Increasing applications of smart devices and wearables in healthcare, such as glucometer, tablets, smartphones, smartwatches and headphones, heartrate cuff, bands and others, is expanding the scope of internet of things, especially in healthcare as they give special attention to access the patients remotely. Moreover, the tracker system in these devices enables to access patients in emergency by sending emergency alerts to seek medical help. Technological advancements in smartphone technology for improving disease diagnosis are anticipated to drive the growth of the internet of things in the healthcare market. Moreover, smartphones offer benefits such as large storage capacity, ease of use, and portability, making them an optimal solution for monitoring and diagnostic services.
Growing affordability and reduction in hardware costs are driving the demand for smartphones in the market, which in turn is expected to drive the growth of the market. In addition to this, measures are taken to improve the security of the data. For instance, in December 2022, Palo Alto Networks, announced medical IoT security a Zero Trust Security for medical devices. This will enable the healthcare providers to manage the connected devices securely and quickly. It is a type of cybersecurity that provides security to the data of the organization by verifying every individual user and device.
High penetration of smartphones is also one of the significant factors boosting the growth of internet of things in healthcare market. As per The Mobile Economy 2022, smartphone penetration was 67% of the global population in 2021 and is expected to reach 85% by 2025. Increase in the number of mobile subscriptions is also contributing to an increase in the demand for IoT solutions. Rise in the number of mobile subscriptions in emerging economies such as India, China, Indonesia, Bangladesh, and some African & Latin American countries is expected to further drive the market growth. In addition, continuous improvements in network infrastructure and growing network coverage are also creating opportunities for the key players to grow in the market. Moreover, the usage of mobile devices is rising among physicians.
The outbreak of COVID-19 had a positive impact on the IoT in the healthcare market. During the pandemic, the risk of getting infected with novel coronavirus while treatments and patient visits to the hospital was rising. This has led hospitals and healthcare systems adopt IoT in healthcare diagnosis increasingly to avoid the spread of viral infection.
Internet of Things in Healthcare Market Segmentations:
By Component
By Connectivity Technology
By Application
By End-use
Chapter 1. Introduction
1.1. Research Objective
1.2. Scope of the Study
1.3. Definition
Chapter 2. Research Methodology
2.1. Research Approach
2.2. Data Sources
2.3. Assumptions & Limitations
Chapter 3. Executive Summary
3.1. Market Snapshot
Chapter 4. Market Variables and Scope
4.1. Introduction
4.2. Market Classification and Scope
4.3. Industry Value Chain Analysis
4.3.1. Raw Material Procurement Analysis
4.3.2. Sales and Distribution Channel Analysis
4.3.3. Downstream Buyer Analysis
Chapter 5. COVID 19 Impact on Internet of Things in Healthcare Market
5.1. COVID-19 Landscape: Internet of Things in Healthcare Industry Impact
5.2. COVID 19 - Impact Assessment for the Industry
5.3. COVID 19 Impact: Global Major Government Policy
5.4. Market Trends and Opportunities in the COVID-19 Landscape
Chapter 6. Market Dynamics Analysis and Trends
6.1. Market Dynamics
6.1.1. Market Drivers
6.1.2. Market Restraints
6.1.3. Market Opportunities
6.2. Porter’s Five Forces Analysis
6.2.1. Bargaining power of suppliers
6.2.2. Bargaining power of buyers
6.2.3. Threat of substitute
6.2.4. Threat of new entrants
6.2.5. Degree of competition
Chapter 7. Competitive Landscape
7.1.1. Company Market Share/Positioning Analysis
7.1.2. Key Strategies Adopted by Players
7.1.3. Vendor Landscape
7.1.3.1. List of Suppliers
7.1.3.2. List of Buyers
Chapter 8. Global Internet of Things in Healthcare Market, By Component
8.1. Internet of Things in Healthcare Market, by Component, 2023-2032
8.1.1. Medical Devices
8.1.1.1. Market Revenue and Forecast (2020-2032)
8.1.2. System and Software
8.1.2.1. Market Revenue and Forecast (2020-2032)
8.1.3. Services
8.1.3.1. Market Revenue and Forecast (2020-2032)
Chapter 9. Global Internet of Things in Healthcare Market, By Connectivity Technology
9.1. Internet of Things in Healthcare Market, by Connectivity Technology, 2023-2032
9.1.1. Cellular
9.1.1.1. Market Revenue and Forecast (2020-2032)
9.1.2. Wi-Fi
9.1.2.1. Market Revenue and Forecast (2020-2032)
9.1.3. Bluetooth
9.1.3.1. Market Revenue and Forecast (2020-2032)
9.1.4. LPWANs
9.1.4.1. Market Revenue and Forecast (2020-2032)
9.1.5. Zigbee
9.1.5.1. Market Revenue and Forecast (2020-2032)
9.1.6. RFID
9.1.6.1. Market Revenue and Forecast (2020-2032)
Chapter 10. Global Internet of Things in Healthcare Market, By Application
10.1. Internet of Things in Healthcare Market, by Application, 2023-2032
10.1.1. Telemedicine
10.1.1.1. Market Revenue and Forecast (2020-2032)
10.1.2. Patient Monitoring
10.1.2.1. Market Revenue and Forecast (2020-2032)
10.1.3. Connected Imaging
10.1.3.1. Market Revenue and Forecast (2020-2032)
10.1.4. Clinical Operations
10.1.4.1. Market Revenue and Forecast (2020-2032)
10.1.5. Medical Management
10.1.5.1. Market Revenue and Forecast (2020-2032)
10.1.6. Others
10.1.6.1. Market Revenue and Forecast (2020-2032)
Chapter 11. Global Internet of Things in Healthcare Market, By End-use
11.1. Internet of Things in Healthcare Market, by End-use, 2023-2032
11.1.1. Hospitals and Clinics
11.1.1.1. Market Revenue and Forecast (2020-2032)
11.1.2. Clinical Research Organizations
11.1.2.1. Market Revenue and Forecast (2020-2032)
11.1.3. Research and Diagnostic Laboratories
11.1.3.1. Market Revenue and Forecast (2020-2032)
11.1.4. Others
11.1.4.1. Market Revenue and Forecast (2020-2032)
Chapter 12. Global Internet of Things in Healthcare Market, Regional Estimates and Trend Forecast
12.1. North America
12.1.1. Market Revenue and Forecast, by Component (2020-2032)
12.1.2. Market Revenue and Forecast, by Connectivity Technology (2020-2032)
12.1.3. Market Revenue and Forecast, by Application (2020-2032)
12.1.4. Market Revenue and Forecast, by End-use (2020-2032)
12.1.5. U.S.
12.1.5.1. Market Revenue and Forecast, by Component (2020-2032)
12.1.5.2. Market Revenue and Forecast, by Connectivity Technology (2020-2032)
12.1.5.3. Market Revenue and Forecast, by Application (2020-2032)
12.1.5.4. Market Revenue and Forecast, by End-use (2020-2032)
12.1.6. Rest of North America
12.1.6.1. Market Revenue and Forecast, by Component (2020-2032)
12.1.6.2. Market Revenue and Forecast, by Connectivity Technology (2020-2032)
12.1.6.3. Market Revenue and Forecast, by Application (2020-2032)
12.1.6.4. Market Revenue and Forecast, by End-use (2020-2032)
12.2. Europe
12.2.1. Market Revenue and Forecast, by Component (2020-2032)
12.2.2. Market Revenue and Forecast, by Connectivity Technology (2020-2032)
12.2.3. Market Revenue and Forecast, by Application (2020-2032)
12.2.4. Market Revenue and Forecast, by End-use (2020-2032)
12.2.5. UK
12.2.5.1. Market Revenue and Forecast, by Component (2020-2032)
12.2.5.2. Market Revenue and Forecast, by Connectivity Technology (2020-2032)
12.2.5.3. Market Revenue and Forecast, by Application (2020-2032)
12.2.5.4. Market Revenue and Forecast, by End-use (2020-2032)
12.2.6. Germany
12.2.6.1. Market Revenue and Forecast, by Component (2020-2032)
12.2.6.2. Market Revenue and Forecast, by Connectivity Technology (2020-2032)
12.2.6.3. Market Revenue and Forecast, by Application (2020-2032)
12.2.6.4. Market Revenue and Forecast, by End-use (2020-2032)
12.2.7. France
12.2.7.1. Market Revenue and Forecast, by Component (2020-2032)
12.2.7.2. Market Revenue and Forecast, by Connectivity Technology (2020-2032)
12.2.7.3. Market Revenue and Forecast, by Application (2020-2032)
12.2.7.4. Market Revenue and Forecast, by End-use (2020-2032)
12.2.8. Rest of Europe
12.2.8.1. Market Revenue and Forecast, by Component (2020-2032)
12.2.8.2. Market Revenue and Forecast, by Connectivity Technology (2020-2032)
12.2.8.3. Market Revenue and Forecast, by Application (2020-2032)
12.2.8.4. Market Revenue and Forecast, by End-use (2020-2032)
12.3. APAC
12.3.1. Market Revenue and Forecast, by Component (2020-2032)
12.3.2. Market Revenue and Forecast, by Connectivity Technology (2020-2032)
12.3.3. Market Revenue and Forecast, by Application (2020-2032)
12.3.4. Market Revenue and Forecast, by End-use (2020-2032)
12.3.5. India
12.3.5.1. Market Revenue and Forecast, by Component (2020-2032)
12.3.5.2. Market Revenue and Forecast, by Connectivity Technology (2020-2032)
12.3.5.3. Market Revenue and Forecast, by Application (2020-2032)
12.3.5.4. Market Revenue and Forecast, by End-use (2020-2032)
12.3.6. China
12.3.6.1. Market Revenue and Forecast, by Component (2020-2032)
12.3.6.2. Market Revenue and Forecast, by Connectivity Technology (2020-2032)
12.3.6.3. Market Revenue and Forecast, by Application (2020-2032)
12.3.6.4. Market Revenue and Forecast, by End-use (2020-2032)
12.3.7. Japan
12.3.7.1. Market Revenue and Forecast, by Component (2020-2032)
12.3.7.2. Market Revenue and Forecast, by Connectivity Technology (2020-2032)
12.3.7.3. Market Revenue and Forecast, by Application (2020-2032)
12.3.7.4. Market Revenue and Forecast, by End-use (2020-2032)
12.3.8. Rest of APAC
12.3.8.1. Market Revenue and Forecast, by Component (2020-2032)
12.3.8.2. Market Revenue and Forecast, by Connectivity Technology (2020-2032)
12.3.8.3. Market Revenue and Forecast, by Application (2020-2032)
12.3.8.4. Market Revenue and Forecast, by End-use (2020-2032)
12.4. MEA
12.4.1. Market Revenue and Forecast, by Component (2020-2032)
12.4.2. Market Revenue and Forecast, by Connectivity Technology (2020-2032)
12.4.3. Market Revenue and Forecast, by Application (2020-2032)
12.4.4. Market Revenue and Forecast, by End-use (2020-2032)
12.4.5. GCC
12.4.5.1. Market Revenue and Forecast, by Component (2020-2032)
12.4.5.2. Market Revenue and Forecast, by Connectivity Technology (2020-2032)
12.4.5.3. Market Revenue and Forecast, by Application (2020-2032)
12.4.5.4. Market Revenue and Forecast, by End-use (2020-2032)
12.4.6. North Africa
12.4.6.1. Market Revenue and Forecast, by Component (2020-2032)
12.4.6.2. Market Revenue and Forecast, by Connectivity Technology (2020-2032)
12.4.6.3. Market Revenue and Forecast, by Application (2020-2032)
12.4.6.4. Market Revenue and Forecast, by End-use (2020-2032)
12.4.7. South Africa
12.4.7.1. Market Revenue and Forecast, by Component (2020-2032)
12.4.7.2. Market Revenue and Forecast, by Connectivity Technology (2020-2032)
12.4.7.3. Market Revenue and Forecast, by Application (2020-2032)
12.4.7.4. Market Revenue and Forecast, by End-use (2020-2032)
12.4.8. Rest of MEA
12.4.8.1. Market Revenue and Forecast, by Component (2020-2032)
12.4.8.2. Market Revenue and Forecast, by Connectivity Technology (2020-2032)
12.4.8.3. Market Revenue and Forecast, by Application (2020-2032)
12.4.8.4. Market Revenue and Forecast, by End-use (2020-2032)
12.5. Latin America
12.5.1. Market Revenue and Forecast, by Component (2020-2032)
12.5.2. Market Revenue and Forecast, by Connectivity Technology (2020-2032)
12.5.3. Market Revenue and Forecast, by Application (2020-2032)
12.5.4. Market Revenue and Forecast, by End-use (2020-2032)
12.5.5. Brazil
12.5.5.1. Market Revenue and Forecast, by Component (2020-2032)
12.5.5.2. Market Revenue and Forecast, by Connectivity Technology (2020-2032)
12.5.5.3. Market Revenue and Forecast, by Application (2020-2032)
12.5.5.4. Market Revenue and Forecast, by End-use (2020-2032)
12.5.6. Rest of LATAM
12.5.6.1. Market Revenue and Forecast, by Component (2020-2032)
12.5.6.2. Market Revenue and Forecast, by Connectivity Technology (2020-2032)
12.5.6.3. Market Revenue and Forecast, by Application (2020-2032)
12.5.6.4. Market Revenue and Forecast, by End-use (2020-2032)
Chapter 13. Company Profiles
13.1. Medtronic
13.1.1. Company Overview
13.1.2. Product Offerings
13.1.3. Financial Performance
13.1.4. Recent Initiatives
13.2. Cisco Systems; Inc.
13.2.1. Company Overview
13.2.2. Product Offerings
13.2.3. Financial Performance
13.2.4. Recent Initiatives
13.3. IBM Corporation
13.3.1. Company Overview
13.3.2. Product Offerings
13.3.3. Financial Performance
13.3.4. Recent Initiatives
13.4. GE Healthcare
13.4.1. Company Overview
13.4.2. Product Offerings
13.4.3. Financial Performance
13.4.4. Recent Initiatives
13.5. Microsoft Corporation
13.5.1. Company Overview
13.5.2. Product Offerings
13.5.3. Financial Performance
13.5.4. Recent Initiatives
13.6. SAP SE
13.6.1. Company Overview
13.6.2. Product Offerings
13.6.3. Financial Performance
13.6.4. Recent Initiatives
13.7. Infosys Limited
13.7.1. Company Overview
13.7.2. Product Offerings
13.7.3. Financial Performance
13.7.4. Recent Initiatives
13.8. Cerner Corporation
13.8.1. Company Overview
13.8.2. Product Offerings
13.8.3. Financial Performance
13.8.4. Recent Initiatives
13.9. QUALCOMM Incorporated
13.9.1. Company Overview
13.9.2. Product Offerings
13.9.3. Financial Performance
13.9.4. Recent Initiatives
13.10. Amazon
13.10.1. Company Overview
13.10.2. Product Offerings
13.10.3. Financial Performance
13.10.4. Recent Initiatives
Chapter 14. Research Methodology
14.1. Primary Research
14.2. Secondary Research
14.3. Assumptions
Chapter 15. Appendix
15.1. About Us
15.2. Glossary of Terms
 Cross-segment Market Size and Analysis for
Mentioned Segments
Additional Company Profiles (Upto 5 With No Cost)
Additional Countries (Apart From Mentioned Countries)
Country/Region-specific Report
Go To Market Strategy
Region Specific Market DynamicsRegion Level Market Share Import Export AnalysisProduction AnalysisOthers
Cross-segment Market Size and Analysis for
Mentioned Segments
Additional Company Profiles (Upto 5 With No Cost)
Additional Countries (Apart From Mentioned Countries)
Country/Region-specific Report
Go To Market Strategy
Region Specific Market DynamicsRegion Level Market Share Import Export AnalysisProduction AnalysisOthers