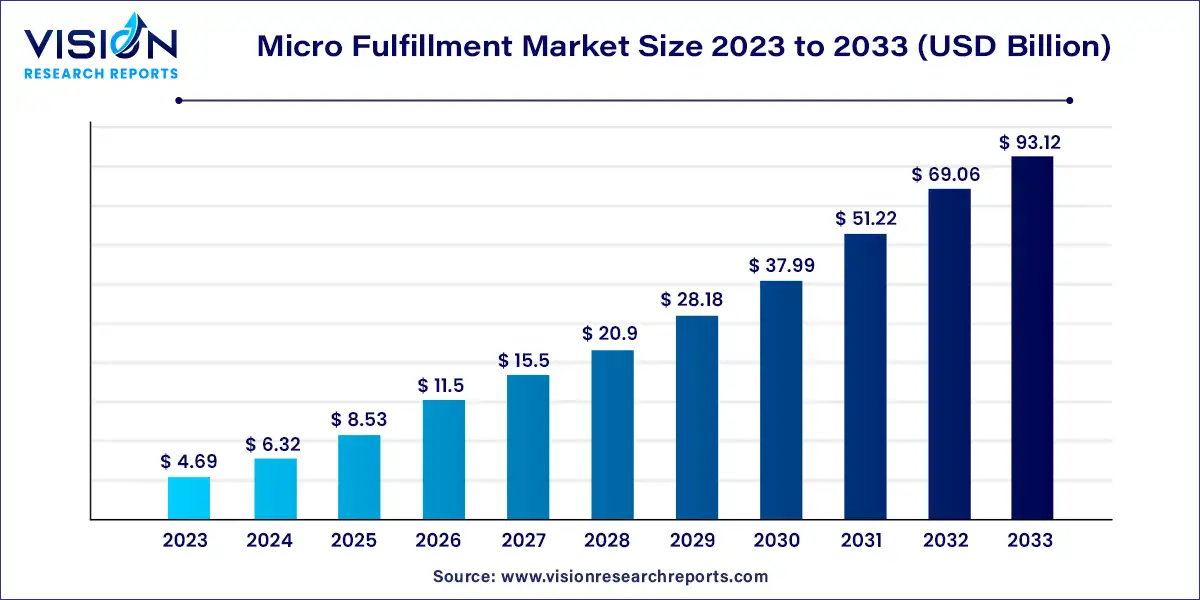
The global micro fulfillment market size was surpassed at USD 4.69 billion in 2023 and is expected to hit around USD 93.12 billion by 2033, growing at a CAGR of 34.83% from 2024 to 2033.

The growth of the micro fulfillment market is primarily driven by the explosive rise in e-commerce has created an urgent demand for faster and more efficient order fulfillment solutions, pushing businesses to adopt micro fulfillment centers (MFCs) to meet consumer expectations for quick delivery. Additionally, advancements in automation and robotics technology have significantly enhanced the efficiency of MFCs, making it feasible to process and ship orders with greater speed and accuracy. Another crucial factor is the increasing urbanization, which necessitates the establishment of localized fulfillment centers to effectively serve densely populated areas. Furthermore, evolving consumer preferences for personalized and rapid service continue to drive the adoption of micro fulfillment strategies. Collectively, these factors are fueling the expansion and development of the micro fulfillment market.
The micro fulfillment market is divided into three main components: hardware, software, and services. Among these, the services segment is projected to experience the highest growth rate, with a compound annual growth rate (CAGR) of 37.14% during the forecast period. This growth is driven by the increasing need for expertise and consultation, technology integration, software solutions, and ongoing maintenance and support. Micro fulfillment systems demand specialized knowledge in areas such as automation, robotics, and software integration. Service providers play a crucial role in helping businesses evaluate their needs, design tailored solutions, and optimize operational workflows to ensure successful implementation and maximum efficiency.
In 2023, the hardware segment held the largest revenue share and is expected to remain dominant throughout the forecast period. Micro fulfillment centers rely on specialized hardware for efficient order picking, packing, and sorting. Essential equipment includes automated storage and retrieval systems (AS/RS), conveyor belts, sortation systems, robotic arms, and shelving units. The complexity of these technologies, which involves sophisticated engineering and precision manufacturing, contributes to their higher costs.
The market is segmented into standalone, store-integrated/in-store, and dark stores. The store-integrated/in-store segment led the market with approximately 49% of the revenue in 2023. Retailers can utilize their existing physical store locations to fulfill online orders, leveraging in-store space and inventory to minimize the need for separate fulfillment centers. This integration allows for the efficient handling of both in-store and online orders, potentially creating synergies between the two shopping experiences. For instance, the buy-online-pick-up-in-store (BOPIS) model enhances convenience for customers and can increase in-store foot traffic and sales.
The dark stores segment is anticipated to see significant growth, driven by the rise in e-commerce and the need for efficient order fulfillment solutions. Dark stores are designed solely for online order processing and do not cater to in-store customers. Their role in the growing online shopping market is expected to expand, with solutions like Attabotics’ vertical storage and retrieval systems optimizing space and streamlining processes in these facilities.
The end-user segment includes e-commerce, traditional retailers and distributors, and manufacturers. Traditional retailers and distributors are expected to experience the highest CAGR of 36.26% during the forecast period. These entities can utilize their existing infrastructure, such as physical stores and warehouses, to support micro fulfillment operations. Repurposing underutilized areas of retail spaces or backrooms for micro fulfillment can enhance space efficiency and reduce the need for additional warehousing.
The e-commerce segment currently dominates the market and is likely to continue its dominance. The rapid growth of e-commerce has transformed consumer shopping behaviors, driving demand for efficient fulfillment solutions. The increasing volume of online orders underscores the need for micro fulfillment systems to maintain high levels of efficiency and speed.
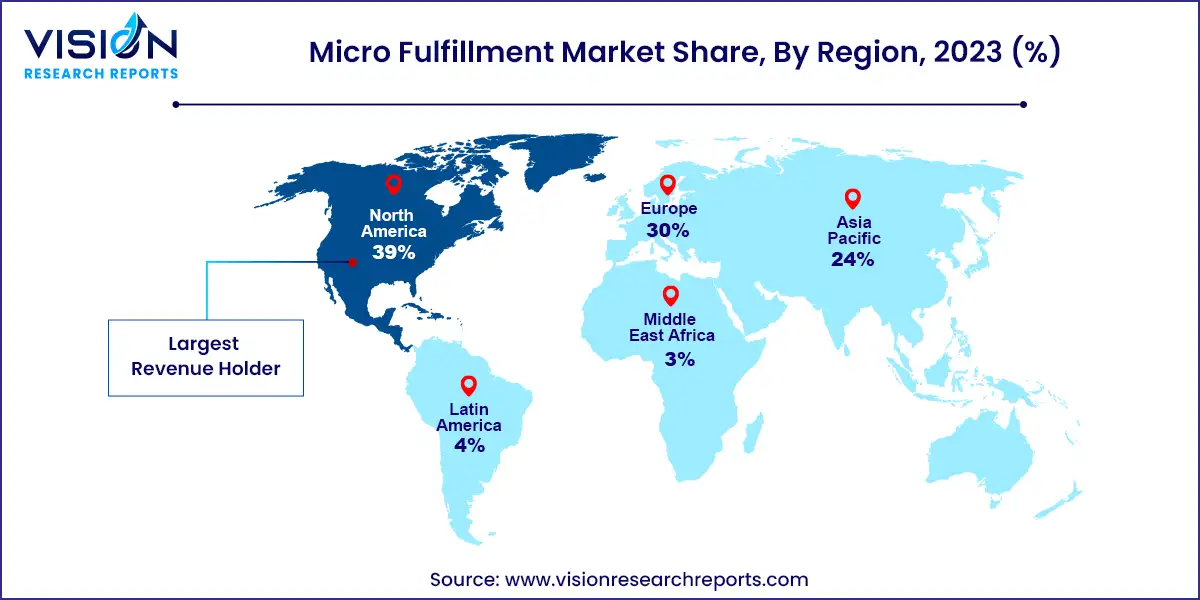
North America led the micro fulfillment market in 2023, capturing 39% of global revenue. Known for its technological innovation, North America has been at the forefront of adopting advanced technologies in micro fulfillment, including automation, robotics, and data analytics. The region has also seen substantial growth in e-commerce, with retail sales reaching USD 1,799.5 billion in the first quarter of 2023, marking a 0.9% increase from the previous quarter. E-commerce sales grew by 7.8%, representing 15.16% of total retail sales.

Asia Pacific is expected to register the highest CAGR of 36.67% during the forecast period. The region's large and rapidly growing population, particularly in countries like China and India, creates a strong demand for efficient last-mile delivery solutions. Micro fulfillment centers located in urban areas can effectively address the needs of this burgeoning market, driving significant growth in the region.
By Component
By Type
By End-user
By Region
Chapter 1. Introduction
1.1. Research Objective
1.2. Scope of the Study
1.3. Definition
Chapter 2. Research Methodology
2.1. Research Approach
2.2. Data Sources
2.3. Assumptions & Limitations
Chapter 3. Executive Summary
3.1. Market Snapshot
Chapter 4. Market Variables and Scope
4.1. Introduction
4.2. Market Classification and Scope
4.3. Industry Value Chain Analysis
4.3.1. Raw Material Procurement Analysis
4.3.2. Sales and Distribution Component Analysis
4.3.3. Downstream Buyer Analysis
Chapter 5. COVID 19 Impact on Micro Fulfillment Market
5.1. COVID-19 Landscape: Micro Fulfillment Industry Impact
5.2. COVID 19 - Impact Assessment for the Industry
5.3. COVID 19 Impact: Global Major Government Policy
5.4. Market Trends and Opportunities in the COVID-19 Landscape
Chapter 6. Market Dynamics Analysis and Trends
6.1. Market Dynamics
6.1.1. Market Drivers
6.1.2. Market Restraints
6.1.3. Market Opportunities
6.2. Porter’s Five Forces Analysis
6.2.1. Bargaining power of suppliers
6.2.2. Bargaining power of buyers
6.2.3. Threat of substitute
6.2.4. Threat of new entrants
6.2.5. Degree of competition
Chapter 7. Competitive Landscape
7.1.1. Company Market Share/Positioning Analysis
7.1.2. Key Strategies Adopted by Players
7.1.3. Vendor Landscape
7.1.3.1. List of Suppliers
7.1.3.2. List of Buyers
Chapter 8. Global Micro Fulfillment Market, By Component
8.1. Micro Fulfillment Market, by Component, 2024-2033
8.1.1 Hardware
8.1.1.1. Market Revenue and Forecast (2021-2033)
8.1.2. Software
8.1.2.1. Market Revenue and Forecast (2021-2033)
8.1.3. Services
8.1.3.1. Market Revenue and Forecast (2021-2033)
Chapter 9. Global Micro Fulfillment Market, By Type
9.1. Micro Fulfillment Market, by Type, 2024-2033
9.1.1. Standalone
9.1.1.1. Market Revenue and Forecast (2021-2033)
9.1.2. Store-integrated/in Store
9.1.2.1. Market Revenue and Forecast (2021-2033)
9.1.3. Dark Stores
9.1.3.1. Market Revenue and Forecast (2021-2033)
Chapter 10. Global Micro Fulfillment Market, By End-user
10.1. Micro Fulfillment Market, by End-user, 2024-2033
10.1.1. E-commerce
10.1.1.1. Market Revenue and Forecast (2021-2033)
10.1.2. Traditional Retailers & Distributors
10.1.2.1. Market Revenue and Forecast (2021-2033)
10.1.3. Manufacturers
10.1.3.1. Market Revenue and Forecast (2021-2033)
Chapter 11. Global Micro Fulfillment Market, Regional Estimates and Trend Forecast
11.1. North America
11.1.1. Market Revenue and Forecast, by Component (2021-2033)
11.1.2. Market Revenue and Forecast, by Type (2021-2033)
11.1.3. Market Revenue and Forecast, by End-user (2021-2033)
11.1.4. U.S.
11.1.4.1. Market Revenue and Forecast, by Component (2021-2033)
11.1.4.2. Market Revenue and Forecast, by Type (2021-2033)
11.1.4.3. Market Revenue and Forecast, by End-user (2021-2033)
11.1.5. Rest of North America
11.1.5.1. Market Revenue and Forecast, by Component (2021-2033)
11.1.5.2. Market Revenue and Forecast, by Type (2021-2033)
11.1.5.3. Market Revenue and Forecast, by End-user (2021-2033)
11.2. Europe
11.2.1. Market Revenue and Forecast, by Component (2021-2033)
11.2.2. Market Revenue and Forecast, by Type (2021-2033)
11.2.3. Market Revenue and Forecast, by End-user (2021-2033)
11.2.4. UK
11.2.4.1. Market Revenue and Forecast, by Component (2021-2033)
11.2.4.2. Market Revenue and Forecast, by Type (2021-2033)
11.2.4.3. Market Revenue and Forecast, by End-user (2021-2033)
11.2.5. Germany
11.2.5.1. Market Revenue and Forecast, by Component (2021-2033)
11.2.5.2. Market Revenue and Forecast, by Type (2021-2033)
11.2.5.3. Market Revenue and Forecast, by End-user (2021-2033)
11.2.6. France
11.2.6.1. Market Revenue and Forecast, by Component (2021-2033)
11.2.6.2. Market Revenue and Forecast, by Type (2021-2033)
11.2.6.3. Market Revenue and Forecast, by End-user (2021-2033)
11.2.7. Rest of Europe
11.2.7.1. Market Revenue and Forecast, by Component (2021-2033)
11.2.7.2. Market Revenue and Forecast, by Type (2021-2033)
11.2.7.3. Market Revenue and Forecast, by End-user (2021-2033)
11.3. APAC
11.3.1. Market Revenue and Forecast, by Component (2021-2033)
11.3.2. Market Revenue and Forecast, by Type (2021-2033)
11.3.3. Market Revenue and Forecast, by End-user (2021-2033)
11.3.4. India
11.3.4.1. Market Revenue and Forecast, by Component (2021-2033)
11.3.4.2. Market Revenue and Forecast, by Type (2021-2033)
11.3.4.3. Market Revenue and Forecast, by End-user (2021-2033)
11.3.5. China
11.3.5.1. Market Revenue and Forecast, by Component (2021-2033)
11.3.5.2. Market Revenue and Forecast, by Type (2021-2033)
11.3.5.3. Market Revenue and Forecast, by End-user (2021-2033)
11.3.6. Japan
11.3.6.1. Market Revenue and Forecast, by Component (2021-2033)
11.3.6.2. Market Revenue and Forecast, by Type (2021-2033)
11.3.6.3. Market Revenue and Forecast, by End-user (2021-2033)
11.3.7. Rest of APAC
11.3.7.1. Market Revenue and Forecast, by Component (2021-2033)
11.3.7.2. Market Revenue and Forecast, by Type (2021-2033)
11.3.7.3. Market Revenue and Forecast, by End-user (2021-2033)
11.4. MEA
11.4.1. Market Revenue and Forecast, by Component (2021-2033)
11.4.2. Market Revenue and Forecast, by Type (2021-2033)
11.4.3. Market Revenue and Forecast, by End-user (2021-2033)
11.4.4. GCC
11.4.4.1. Market Revenue and Forecast, by Component (2021-2033)
11.4.4.2. Market Revenue and Forecast, by Type (2021-2033)
11.4.4.3. Market Revenue and Forecast, by End-user (2021-2033)
11.4.5. North Africa
11.4.5.1. Market Revenue and Forecast, by Component (2021-2033)
11.4.5.2. Market Revenue and Forecast, by Type (2021-2033)
11.4.5.3. Market Revenue and Forecast, by End-user (2021-2033)
11.4.6. South Africa
11.4.6.1. Market Revenue and Forecast, by Component (2021-2033)
11.4.6.2. Market Revenue and Forecast, by Type (2021-2033)
11.4.6.3. Market Revenue and Forecast, by End-user (2021-2033)
11.4.7. Rest of MEA
11.4.7.1. Market Revenue and Forecast, by Component (2021-2033)
11.4.7.2. Market Revenue and Forecast, by Type (2021-2033)
11.4.7.3. Market Revenue and Forecast, by End-user (2021-2033)
11.5. Latin America
11.5.1. Market Revenue and Forecast, by Component (2021-2033)
11.5.2. Market Revenue and Forecast, by Type (2021-2033)
11.5.3. Market Revenue and Forecast, by End-user (2021-2033)
11.5.4. Brazil
11.5.4.1. Market Revenue and Forecast, by Component (2021-2033)
11.5.4.2. Market Revenue and Forecast, by Type (2021-2033)
11.5.4.3. Market Revenue and Forecast, by End-user (2021-2033)
11.5.5. Rest of LATAM
11.5.5.1. Market Revenue and Forecast, by Component (2021-2033)
11.5.5.2. Market Revenue and Forecast, by Type (2021-2033)
11.5.5.3. Market Revenue and Forecast, by End-user (2021-2033)
Chapter 12. Company Profiles
12.1. Alert Innovation, Inc.
12.1.1. Company Overview
12.1.2. Product Offerings
12.1.3. Financial Performance
12.1.4. Recent Initiatives
12.2. Dematic
12.2.1. Company Overview
12.2.2. Product Offerings
12.2.3. Financial Performance
12.2.4. Recent Initiatives
12.3. Honeywell International Inc.
12.3.1. Company Overview
12.3.2. Product Offerings
12.3.3. Financial Performance
12.3.4. Recent Initiatives
12.4. OPEX Corporation
12.4.1. Company Overview
12.4.2. Product Offerings
12.4.3. Financial Performance
12.4.4. Recent Initiatives
12.5. Swisslog Holding AG
12.5.1. Company Overview
12.5.2. Product Offerings
12.5.3. Financial Performance
12.5.4. Recent Initiatives
12.6. AutoStore
12.6.1. Company Overview
12.6.2. Product Offerings
12.6.3. Financial Performance
12.6.4. Recent Initiatives
12.7. Exotec SAS
12.7.1. Company Overview
12.7.2. Product Offerings
12.7.3. Financial Performance
12.7.4. Recent Initiatives
12.8. Takeoff Technologies Inc.
12.8.1. Company Overview
12.8.2. Product Offerings
12.8.3. Financial Performance
12.8.4. Recent Initiatives
12.9. TGW Logistic Group GMBH
12.9.1. Company Overview
12.9.2. Product Offerings
12.9.3. Financial Performance
12.9.4. Recent Initiatives
12.10. Get Fabric, Inc.
12.10.1. Company Overview
12.10.2. Product Offerings
12.10.3. Financial Performance
12.10.4. Recent Initiatives
Chapter 13. Research Methodology
13.1. Primary Research
13.2. Secondary Research
13.3. Assumptions
Chapter 14. Appendix
14.1. About Us
14.2. Glossary of Terms
 Cross-segment Market Size and Analysis for
Mentioned Segments
 Additional Company Profiles (Upto 5 With No Cost)
 Additional Countries (Apart From Mentioned Countries)
 Country/Region-specific Report
 Go To Market Strategy
 Region Specific Market Dynamics
 Region Level Market Share
 Import Export Analysis
 Production Analysis
 Others