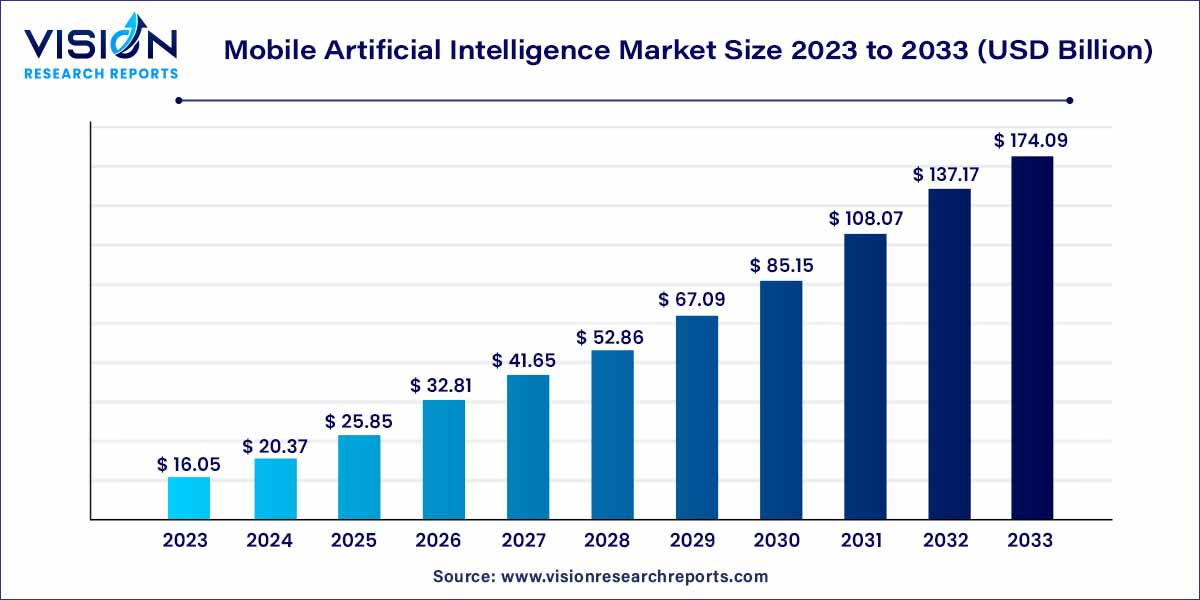
The global mobile artificial intelligence market size was estimated at USD 16.05 billion in 2023 and it is expected to surpass around USD 174.09 billion by 2033, poised to grow at a CAGR of 26.92% from 2024 to 2033.

The mobile artificial intelligence (AI) market stands at the forefront of technological innovation, where the amalgamation of AI capabilities and mobile devices is reshaping industries and revolutionizing user experiences. This synergy combines the computational power of AI algorithms with the ubiquitous presence and portability of smartphones and tablets, leading to a transformative impact across various sectors.
The growth of the mobile artificial intelligence (AI) market can be attributed to several key factors. Firstly, the increasing demand for personalized and seamless user experiences has driven the integration of AI algorithms into mobile devices. This demand is further fueled by the rising popularity of applications like virtual assistants and image recognition systems. Secondly, the advent of 5G technology has significantly enhanced the capabilities of mobile AI, enabling real-time processing of complex algorithms and facilitating immersive experiences like augmented reality and virtual reality on mobile platforms. Additionally, substantial investments from tech giants and startups alike have accelerated research and development efforts, leading to the creation of innovative AI-powered applications for mobile devices. Furthermore, the continuous evolution of AI algorithms, enabling tasks that were previously exclusive to desktop computers, has expanded the scope of mobile AI applications. Lastly, the market benefits from increasing awareness among businesses about the potential of mobile AI in optimizing processes, improving customer engagement, and gaining a competitive advantage, driving further growth in the industry.
| Report Coverage | Details |
| Revenue Share of North America in 2023 | 32% |
| Revenue Forecast by 2033 | USD 174.09 billion |
| Growth Rate from 2024 to 2033 | CAGR of 26.92% |
| Base Year | 2023 |
| Forecast Period | 2024 to 2033 |
| Market Analysis (Terms Used) | Value (US$ Million/Billion) or (Volume/Units) |
The 10 nm segment dominated the global market with the largest market share of 46% in 2023. With the 10 nm technology, mobile processors have become substantially smaller and more energy-efficient than their predecessors. This reduction in size allows for the integration of more transistors within the same physical space, leading to enhanced processing power. Mobile devices powered by 10 nm chips exhibit improved performance, enabling seamless execution of complex AI algorithms. This is particularly crucial for AI applications that demand real-time processing, such as voice recognition, image analysis, and augmented reality experiences.
7 nm technology node is expected to grow at the fastest CAGR of 32.55% during the forecast period. 7 nm technology represents a groundbreaking achievement in semiconductor manufacturing. With even smaller transistor sizes and improved energy efficiency, mobile processors built on 7 nm technology deliver unparalleled computational prowess. The precision of this technology allows for intricate and intricate circuitry, enabling mobile devices to handle AI tasks with exceptional speed and accuracy. The reduced power consumption enhances the battery life of mobile devices, ensuring prolonged usage without compromising on performance.
The smartphone segment dominated the market with the highest market share of 38% in 2023. Smartphones are now equipped with virtual assistants powered by AI algorithms, enabling natural language processing, voice recognition, and contextual understanding. These features facilitate tasks such as setting reminders, sending messages, and providing personalized recommendations, enhancing user productivity and convenience. Additionally, Mobile AI is integrated into smartphone cameras, enabling functionalities like facial recognition, object detection, and image enhancement. This integration not only improves photography but also enhances security measures through features like facial recognition-based unlocking mechanisms.
In the field of robotics, mobile AI applications have revolutionized the capabilities of robots, making them more adaptive and intelligent. AI-powered robots can perform intricate tasks with precision, ranging from warehouse automation and manufacturing processes to healthcare assistance and customer service. These robots utilize Mobile AI algorithms to perceive their environment, make decisions, and interact with humans seamlessly. For instance, in healthcare, AI-enabled robotic assistants can aid medical professionals by performing tasks like medication delivery, patient monitoring, and even surgeries under human supervision. In manufacturing, robots equipped with mobile AI technology optimize production processes, ensuring efficiency and quality control. Furthermore, in customer service, AI-driven robots engage with customers, providing assistance and information, thereby enhancing customer satisfaction.
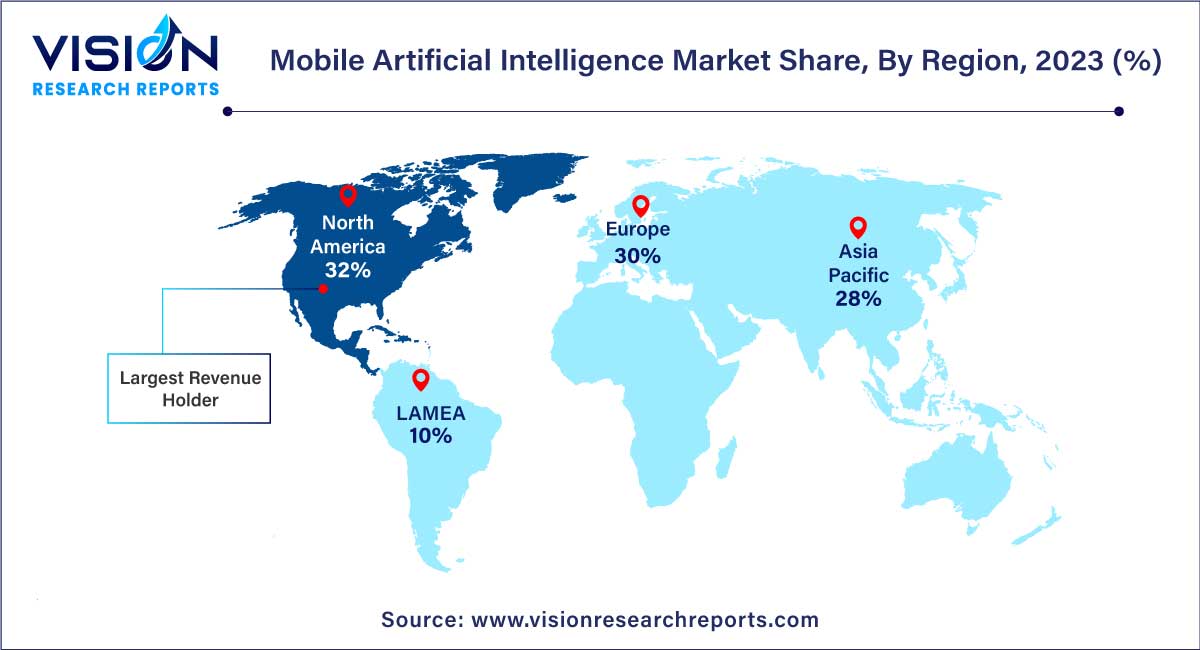
North America dominated the market with the largest market share of 32% in 2023. In North America, particularly in the United States, the market is driven by a robust technology ecosystem and significant investments in research and development. Tech giants and startups alike are pioneering innovative mobile AI applications, especially in sectors like healthcare, finance, and autonomous vehicles. The region benefits from a skilled workforce, advanced infrastructure, and a high level of awareness about the potential of Mobile AI, fueling its rapid growth.

Asia Pacific is predicted to grow at the remarkable CAGR during the forecast period. Asia-Pacific, particularly China, Japan, and South Korea, emerges as a powerhouse in the Mobile AI market. With a tech-savvy population and a robust manufacturing sector, Asia-Pacific nations are at the forefront of innovation. China, in particular, boasts a thriving Mobile AI industry, driven by both government initiatives and private investments. Chinese companies are leading advancements in areas like facial recognition technology, mobile payment solutions, and autonomous vehicles, contributing significantly to the global market.
By Technology Node
By Application
By Region
Chapter 1. Introduction
1.1. Research Objective
1.2. Scope of the Study
1.3. Definition
Chapter 2. Research Methodology
2.1. Research Approach
2.2. Data Sources
2.3. Assumptions & Limitations
Chapter 3. Executive Summary
3.1. Market Snapshot
Chapter 4. Market Variables and Scope
4.1. Introduction
4.2. Market Classification and Scope
4.3. Industry Value Chain Analysis
4.3.1. Raw Material Procurement Analysis
4.3.2. Sales and Distribution Channel Analysis
4.3.3. Downstream Buyer Analysis
Chapter 5. COVID 19 Impact on Mobile Artificial Intelligence Market
5.1. COVID-19 Landscape: Mobile Artificial Intelligence Industry Impact
5.2. COVID 19 - Impact Assessment for the Industry
5.3. COVID 19 Impact: Global Major Government Policy
5.4. Market Trends and Opportunities in the COVID-19 Landscape
Chapter 6. Market Dynamics Analysis and Trends
6.1. Market Dynamics
6.1.1. Market Drivers
6.1.2. Market Restraints
6.1.3. Market Opportunities
6.2. Porter’s Five Forces Analysis
6.2.1. Bargaining power of suppliers
6.2.2. Bargaining power of buyers
6.2.3. Threat of substitute
6.2.4. Threat of new entrants
6.2.5. Degree of competition
Chapter 7. Competitive Landscape
7.1.1. Company Market Share/Positioning Analysis
7.1.2. Key Strategies Adopted by Players
7.1.3. Vendor Landscape
7.1.3.1. List of Suppliers
7.1.3.2. List of Buyers
Chapter 8. Global Mobile Artificial Intelligence Market, By Technology Node
8.1. Mobile Artificial Intelligence Market, by Technology Node, 2024-2033
8.1.1. 7 nm
8.1.1.1. Market Revenue and Forecast (2021-2033)
8.1.2. 10 nm
8.1.2.1. Market Revenue and Forecast (2021-2033)
8.1.3. 20-28 nm
8.1.3.1. Market Revenue and Forecast (2021-2033)
8.1.4. Others (12 nm and 14 nm)
8.1.4.1. Market Revenue and Forecast (2021-2033)
Chapter 9. Global Mobile Artificial Intelligence Market, By Application
9.1. Mobile Artificial Intelligence Market, by Application, 2024-2033
9.1.1. Smartphones
9.1.1.1. Market Revenue and Forecast (2021-2033)
9.1.2. cameras
9.1.2.1. Market Revenue and Forecast (2021-2033)
9.1.3. Drones
9.1.3.1. Market Revenue and Forecast (2021-2033)
9.1.4. Automobile
9.1.4.1. Market Revenue and Forecast (2021-2033)
9.1.5. Robotics
9.1.5.1. Market Revenue and Forecast (2021-2033)
9.1.6. AR/VR
9.1.6.1. Market Revenue and Forecast (2021-2033)
9.1.7. Others (smart boards, Laptops, PCs)
9.1.7.1. Market Revenue and Forecast (2021-2033)
Chapter 10. Global Mobile Artificial Intelligence Market, Regional Estimates and Trend Forecast
10.1. North America
10.1.1. Market Revenue and Forecast, by Technology Node (2021-2033)
10.1.2. Market Revenue and Forecast, by Application (2021-2033)
10.1.3. U.S.
10.1.3.1. Market Revenue and Forecast, by Technology Node (2021-2033)
10.1.3.2. Market Revenue and Forecast, by Application (2021-2033)
10.1.4. Rest of North America
10.1.4.1. Market Revenue and Forecast, by Technology Node (2021-2033)
10.1.4.2. Market Revenue and Forecast, by Application (2021-2033)
10.2. Europe
10.2.1. Market Revenue and Forecast, by Technology Node (2021-2033)
10.2.2. Market Revenue and Forecast, by Application (2021-2033)
10.2.3. UK
10.2.3.1. Market Revenue and Forecast, by Technology Node (2021-2033)
10.2.3.2. Market Revenue and Forecast, by Application (2021-2033)
10.2.4. Germany
10.2.4.1. Market Revenue and Forecast, by Technology Node (2021-2033)
10.2.4.2. Market Revenue and Forecast, by Application (2021-2033)
10.2.5. France
10.2.5.1. Market Revenue and Forecast, by Technology Node (2021-2033)
10.2.5.2. Market Revenue and Forecast, by Application (2021-2033)
10.2.6. Rest of Europe
10.2.6.1. Market Revenue and Forecast, by Technology Node (2021-2033)
10.2.6.2. Market Revenue and Forecast, by Application (2021-2033)
10.3. APAC
10.3.1. Market Revenue and Forecast, by Technology Node (2021-2033)
10.3.2. Market Revenue and Forecast, by Application (2021-2033)
10.3.3. India
10.3.3.1. Market Revenue and Forecast, by Technology Node (2021-2033)
10.3.3.2. Market Revenue and Forecast, by Application (2021-2033)
10.3.4. China
10.3.4.1. Market Revenue and Forecast, by Technology Node (2021-2033)
10.3.4.2. Market Revenue and Forecast, by Application (2021-2033)
10.3.5. Japan
10.3.5.1. Market Revenue and Forecast, by Technology Node (2021-2033)
10.3.5.2. Market Revenue and Forecast, by Application (2021-2033)
10.3.6. Rest of APAC
10.3.6.1. Market Revenue and Forecast, by Technology Node (2021-2033)
10.3.6.2. Market Revenue and Forecast, by Application (2021-2033)
10.4. MEA
10.4.1. Market Revenue and Forecast, by Technology Node (2021-2033)
10.4.2. Market Revenue and Forecast, by Application (2021-2033)
10.4.3. GCC
10.4.3.1. Market Revenue and Forecast, by Technology Node (2021-2033)
10.4.3.2. Market Revenue and Forecast, by Application (2021-2033)
10.4.4. North Africa
10.4.4.1. Market Revenue and Forecast, by Technology Node (2021-2033)
10.4.4.2. Market Revenue and Forecast, by Application (2021-2033)
10.4.5. South Africa
10.4.5.1. Market Revenue and Forecast, by Technology Node (2021-2033)
10.4.5.2. Market Revenue and Forecast, by Application (2021-2033)
10.4.6. Rest of MEA
10.4.6.1. Market Revenue and Forecast, by Technology Node (2021-2033)
10.4.6.2. Market Revenue and Forecast, by Application (2021-2033)
10.5. Latin America
10.5.1. Market Revenue and Forecast, by Technology Node (2021-2033)
10.5.2. Market Revenue and Forecast, by Application (2021-2033)
10.5.3. Brazil
10.5.3.1. Market Revenue and Forecast, by Technology Node (2021-2033)
10.5.3.2. Market Revenue and Forecast, by Application (2021-2033)
10.5.4. Rest of LATAM
10.5.4.1. Market Revenue and Forecast, by Technology Node (2021-2033)
10.5.4.2. Market Revenue and Forecast, by Application (2021-2033)
Chapter 11. Company Profiles
11.1. Qualcomm
11.1.1. Company Overview
11.1.2. Product Offerings
11.1.3. Financial Performance
11.1.4. Recent Initiatives
11.2. Nvidia
11.2.1. Company Overview
11.2.2. Product Offerings
11.2.3. Financial Performance
11.2.4. Recent Initiatives
11.3. Intel
11.3.1. Company Overview
11.3.2. Product Offerings
11.3.3. Financial Performance
11.3.4. Recent Initiatives
11.4. IBM
11.4.1. Company Overview
11.4.2. Product Offerings
11.4.3. Financial Performance
11.4.4. LTE Scientific
11.5. Microsoft
11.5.1. Company Overview
11.5.2. Product Offerings
11.5.3. Financial Performance
11.5.4. Recent Initiatives
11.6. Apple
11.6.1. Company Overview
11.6.2. Product Offerings
11.6.3. Financial Performance
11.6.4. Recent Initiatives
11.7. Huawei (Hisilicon)
11.7.1. Company Overview
11.7.2. Product Offerings
11.7.3. Financial Performance
11.7.4. Recent Initiatives
11.8. Alphabet (Google)
11.8.1. Company Overview
11.8.2. Product Offerings
11.8.3. Financial Performance
11.8.4. Recent Initiatives
11.9. Mediatek
11.9.1. Company Overview
11.9.2. Product Offerings
11.9.3. Financial Performance
11.9.4. Recent Initiatives
11.10. Samsung
11.10.1. Company Overview
11.10.2. Product Offerings
11.10.3. Financial Performance
11.10.4. Recent Initiatives
Chapter 12. Research Methodology
12.1. Primary Research
12.2. Secondary Research
12.3. Assumptions
Chapter 13. Appendix
13.1. About Us
13.2. Glossary of Terms
 Cross-segment Market Size and Analysis for
Mentioned Segments
 Additional Company Profiles (Upto 5 With No Cost)
 Additional Countries (Apart From Mentioned Countries)
 Country/Region-specific Report
 Go To Market Strategy
 Region Specific Market Dynamics
 Region Level Market Share
 Import Export Analysis
 Production Analysis
 Others