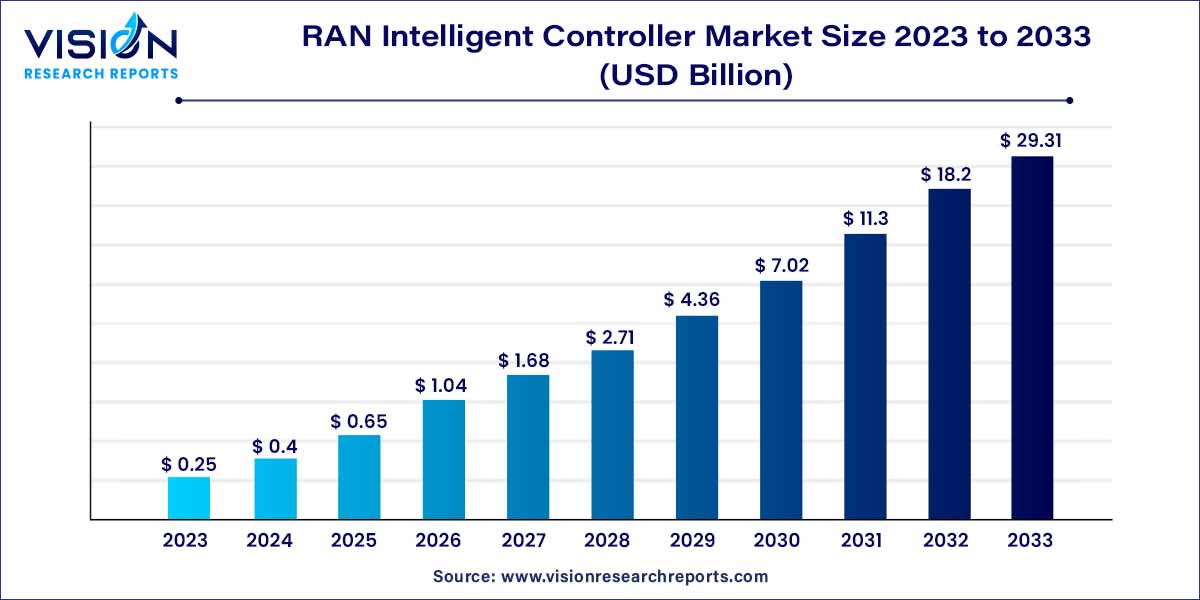
The global RAN intelligent controller market size was surpassed at USD 0.25 billion in 2023 and is expected to hit around USD 29.31 billion by 2033, growing at a CAGR of 61.03% from 2024 to 2033.

The RAN (Radio Access Network) intelligent Controller market has witnessed significant growth and innovation in recent years, driven by the evolving landscape of telecommunications and the demand for enhanced network performance. This article provides an overview of the RAN Intelligent Controller market, exploring its key components, market dynamics, and future prospects.
The growth of the RAN intelligent controller market is propelled by several key factors. Firstly, the rapid adoption of 5G technology worldwide is driving the demand for RAN Intelligent Controllers, as operators seek to leverage advanced network capabilities and support diverse use cases. Additionally, the shift towards cloud-native architectures in telecommunications networks is fueling the deployment of RAN intelligent controllers, enabling operators to achieve greater agility, scalability, and cost efficiency. Moreover, the increasing focus on network automation is driving the adoption of RAN intelligent controllers, as operators seek to streamline operations, optimize performance, and deliver superior quality of service to end-users. These factors collectively contribute to the growth and expansion of the RAN intelligent controller market, positioning it for continued development and innovation in the telecommunications industry.
The platform segment held the dominant position in the overall market, capturing a revenue share of over 64% in 2023. Projections suggest it will maintain robust growth, with a compound annual growth rate (CAGR) of around 60.4% throughout the forecast period. The RAN intelligent controller encompasses software solutions designed to manage RAN operations, aiming to reduce costs and optimize performance. Several market players, including Telefonaktiebolaget LM Ericsson based in Sweden, VMware, Inc. headquartered in the U.S., and Mavenir, offer RAN intelligent controller platforms. Additionally, Accelleran NV, headquartered in Belgium, provides the dRAX RAN intelligent controller, offering real-time analytics to assist mobile network operators in making informed decisions and enhancing network performance.
Meanwhile, the services segment is poised to exhibit the fastest CAGR of 62.02% throughout the forecast period. These services encompass integration, deployment, support, and consulting for the RAN intelligent controller. Deploying RAN may encounter challenges such as integration with legacy systems, high complexity, and technological immaturity. Therefore, support, integration, and deployment services play a crucial role in aiding mobile network operators in efficiently and cost-effectively implementing the platform.
In 2023, the Non-RT RIC segment commanded the largest revenue share, surpassing 60%. Projections indicate it will sustain robust growth, with a forecasted compound annual growth rate (CAGR) exceeding 60.0% throughout the forecast period. Non-RT RIC functionalities encompass device management, fault management, and performance management, among others. It plays a crucial role in optimizing intelligent RAN by offering model management, information, and policy-based guidance to the Near-RT RIC. Leveraging AI, ML, and data analytics, Non-RT RIC determines actions for RAN optimization.
Meanwhile, the Near-RT RIC segment is anticipated to exhibit the fastest CAGR of 62.13% during the forecast period. Near-RT RIC facilitates programmatic control for time cycles ranging from 10 milliseconds to one second. In February 2023, Japan-based NEC Corporation announced the successful demonstration of multi-vendor interoperability and integration of a Near-RT RIC at the O-RAN Global PlugFest 2022 held in Japan. This initiative aimed to meet customer demand for open RAN solutions, showcasing the company's commitment to advancing RAN technology.
In 2023, the 4G segment asserted its dominance in the overall market, capturing a revenue share exceeding 65%. It is poised to maintain substantial growth, with a significant compound annual growth rate (CAGR) surpassing 51.9% throughout the forecast period. 4G, known as the fourth generation of wireless cellular standards, enjoys widespread adoption globally. According to the GSM Association (GSMA)’s 2022 mobile economy report, 4G connections accounted for 58% of total connections in 2021.
On the other hand, the 5G segment is expected to exhibit the fastest CAGR, exceeding 71.45% throughout the forecast period. The rapid adoption of 5G is driven by the increasing sales of 5G-enabled handsets and the expansion of network coverage. According to the GSM Association (GSMA)’s 2022 mobile economy report, 5G connections accounted for 8% of total connections in 2021. Additionally, government initiatives are expected to further propel the growth of the 5G segment. For example, in October 2022, the Indian government announced the launch of 5G services in India. Consequently, mobile operators are likely to leverage RAN intelligent controllers in 5G networks to enhance Quality of Service (QoS) and deliver superior user experiences.
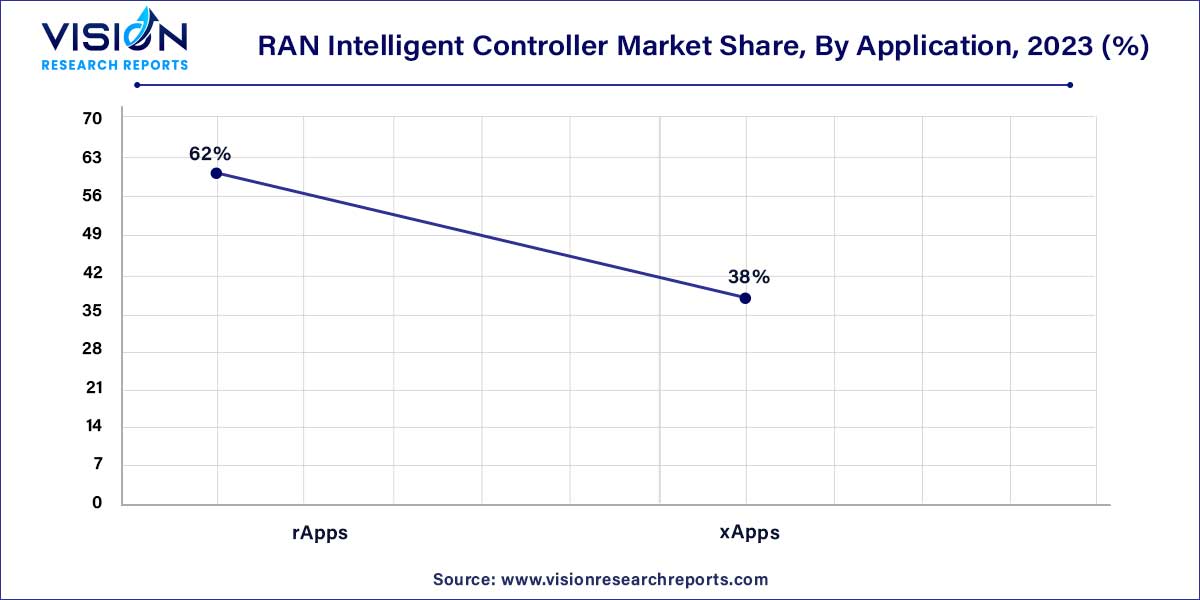
In 2023, the rApps segment asserted its dominance in the overall RAN intelligent controller industry, capturing a revenue share exceeding 62%. It is projected to maintain robust growth, with an anticipated compound annual growth rate (CAGR) of around 61.0% throughout the forecast period. rApp, short for "radio application," is designed to operate on the Non-RT RIC, without the need for response times of less than one second.

According to Sweden-based Telefonaktiebolaget LM Ericsson, the four primary rApp categories are Network evolution rApps, network deployment rApps, network optimization rApps, and network healing rApps, all enabled by Artificial Intelligence (AI) and automation. These applications, which do not require frequent changes within a short timeframe, exemplify the rApp concept. For instance, transmit power optimization serves as an illustrative rApp example, typically necessitating adjustments on the scale of hours rather than milliseconds.
Meanwhile, the xApps segment is poised to experience substantial growth, with a projected CAGR of 60.2% throughout the forecast period. xApps, or "near-real-time applications," are designed to operate on the Near-RT RIC, necessitating execution within a second. These applications offer a range of services or functions, including security, mobility management, and radio resource management. Optimizing network handovers serves as an illustrative example of xApps, as the associated algorithm must run within milliseconds to ensure seamless user network connectivity. Furthermore, xApps play a vital role in implementing Quality of Service (QoS) functions such as congestion or traffic control.
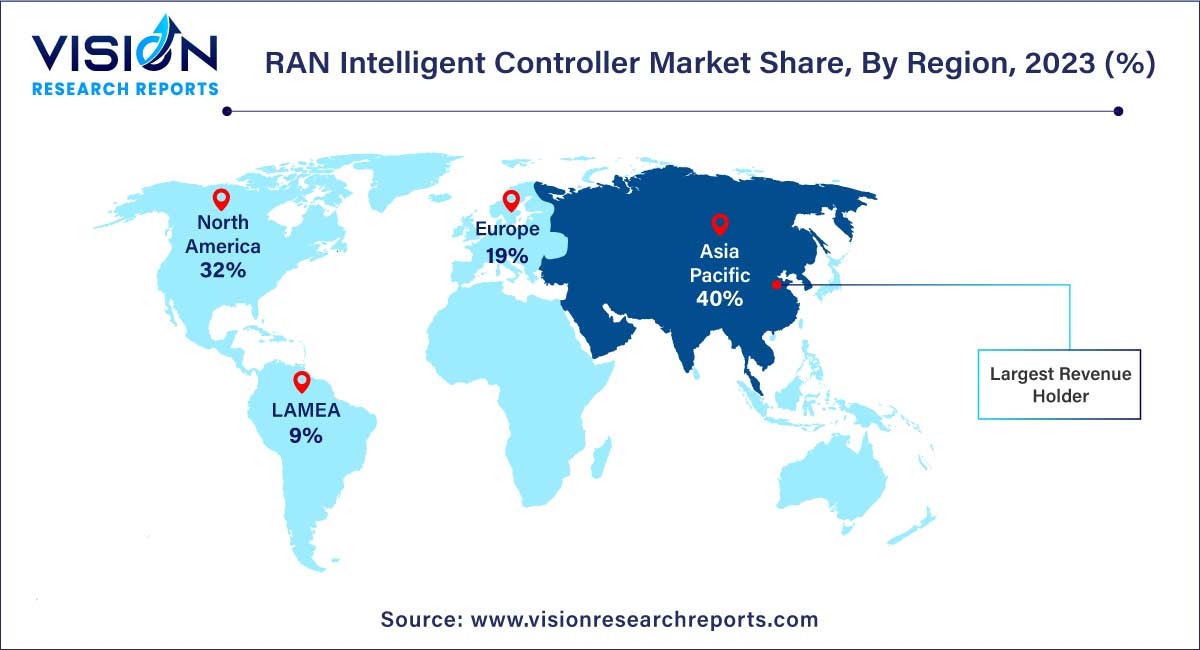
In 2023, Asia Pacific emerged as the leader in the overall market, commanding a revenue share exceeding 40%. Projections suggest it will maintain its position with the fastest compound annual growth rate (CAGR) surpassing 64.0% throughout the forecast period. Asia Pacific boasts prominent market players such as China-based Huawei Technologies Co., Ltd., ZTE Corporation, and South Korea-based SAMSUNG. Furthermore, the region's increasing smartphone penetration and ongoing development of 5G infrastructure are expected to bolster market growth.

Meanwhile, North America is anticipated to experience significant growth, with a projected CAGR of 57.75%. The region benefits from a well-developed technology infrastructure and high levels of internet and smartphone penetration. Additionally, government initiatives aimed at advancing 5G and RIC technologies are expected to contribute to market expansion in North America.
By Component
By Function
By Technology
By Application
By Region
Chapter 1. Introduction
1.1. Research Objective
1.2. Scope of the Study
1.3. Definition
Chapter 2. Research Methodology
2.1. Research Approach
2.2. Data Sources
2.3. Assumptions & Limitations
Chapter 3. Executive Summary
3.1. Market Snapshot
Chapter 4. Market Variables and Scope
4.1. Introduction
4.2. Market Classification and Scope
4.3. Industry Value Chain Analysis
4.3.1. Raw Material Procurement Analysis
4.3.2. Sales and Distribution Channel Analysis
4.3.3. Downstream Buyer Analysis
Chapter 5. COVID 19 Impact on RAN Intelligent Controller Market
5.1. COVID-19 Landscape: RAN Intelligent Controller Industry Impact
5.2. COVID 19 - Impact Assessment for the Industry
5.3. COVID 19 Impact: Global Major Government Policy
5.4. Market Trends and Opportunities in the COVID-19 Landscape
Chapter 6. Market Dynamics Analysis and Trends
6.1. Market Dynamics
6.1.1. Market Drivers
6.1.2. Market Restraints
6.1.3. Market Opportunities
6.2. Porter’s Five Forces Analysis
6.2.1. Bargaining power of suppliers
6.2.2. Bargaining power of buyers
6.2.3. Threat of substitute
6.2.4. Threat of new entrants
6.2.5. Degree of competition
Chapter 7. Competitive Landscape
7.1.1. Company Market Share/Positioning Analysis
7.1.2. Key Strategies Adopted by Players
7.1.3. Vendor Landscape
7.1.3.1. List of Suppliers
7.1.3.2. List of Buyers
Chapter 8. Global RAN Intelligent Controller Market, By Component
8.1. RAN Intelligent Controller Market, by Component, 2024-2033
8.1.1. Platforms
8.1.1.1. Market Revenue and Forecast (2021-2033)
8.1.2. Services
8.1.2.1. Market Revenue and Forecast (2021-2033)
Chapter 9. Global RAN Intelligent Controller Market, By Function
9.1. RAN Intelligent Controller Market, by Function, 2024-2033
9.1.1. Non-RT RIC (Non-Real-Time-RAN Intelligent Controller)
9.1.1.1. Market Revenue and Forecast (2021-2033)
9.1.2. Near-RT RIC (Near-Real-Time-RAN Intelligent Controller)
9.1.2.1. Market Revenue and Forecast (2021-2033)
Chapter 10. Global RAN Intelligent Controller Market, By Technology
10.1. RAN Intelligent Controller Market, by Technology, 2024-2033
10.1.1. 4G
10.1.1.1. Market Revenue and Forecast (2021-2033)
10.1.2. 5G
10.1.2.1. Market Revenue and Forecast (2021-2033)
Chapter 11. Global RAN Intelligent Controller Market, By Application
11.1. RAN Intelligent Controller Market, by Application, 2024-2033
11.1.1. rApps
11.1.1.1. Market Revenue and Forecast (2021-2033)
11.1.2. xApps
11.1.2.1. Market Revenue and Forecast (2021-2033)
`Chapter 12. Global RAN Intelligent Controller Market, Regional Estimates and Trend Forecast
12.1. North America
12.1.1. Market Revenue and Forecast, by Component (2021-2033)
12.1.2. Market Revenue and Forecast, by Function (2021-2033)
12.1.3. Market Revenue and Forecast, by Technology (2021-2033)
12.1.4. Market Revenue and Forecast, by Application (2021-2033)
12.1.5. U.S.
12.1.5.1. Market Revenue and Forecast, by Component (2021-2033)
12.1.5.2. Market Revenue and Forecast, by Function (2021-2033)
12.1.5.3. Market Revenue and Forecast, by Technology (2021-2033)
12.1.5.4. Market Revenue and Forecast, by Application (2021-2033)
12.1.6. Rest of North America
12.1.6.1. Market Revenue and Forecast, by Component (2021-2033)
12.1.6.2. Market Revenue and Forecast, by Function (2021-2033)
12.1.6.3. Market Revenue and Forecast, by Technology (2021-2033)
12.1.6.4. Market Revenue and Forecast, by Application (2021-2033)
12.2. Europe
12.2.1. Market Revenue and Forecast, by Component (2021-2033)
12.2.2. Market Revenue and Forecast, by Function (2021-2033)
12.2.3. Market Revenue and Forecast, by Technology (2021-2033)
12.2.4. Market Revenue and Forecast, by Application (2021-2033)
12.2.5. UK
12.2.5.1. Market Revenue and Forecast, by Component (2021-2033)
12.2.5.2. Market Revenue and Forecast, by Function (2021-2033)
12.2.5.3. Market Revenue and Forecast, by Technology (2021-2033)
12.2.5.4. Market Revenue and Forecast, by Application (2021-2033)
12.2.6. Germany
12.2.6.1. Market Revenue and Forecast, by Component (2021-2033)
12.2.6.2. Market Revenue and Forecast, by Function (2021-2033)
12.2.6.3. Market Revenue and Forecast, by Technology (2021-2033)
12.2.6.4. Market Revenue and Forecast, by Application (2021-2033)
12.2.7. France
12.2.7.1. Market Revenue and Forecast, by Component (2021-2033)
12.2.7.2. Market Revenue and Forecast, by Function (2021-2033)
12.2.7.3. Market Revenue and Forecast, by Technology (2021-2033)
12.2.7.4. Market Revenue and Forecast, by Application (2021-2033)
12.2.8. Rest of Europe
12.2.8.1. Market Revenue and Forecast, by Component (2021-2033)
12.2.8.2. Market Revenue and Forecast, by Function (2021-2033)
12.2.8.3. Market Revenue and Forecast, by Technology (2021-2033)
12.2.8.4. Market Revenue and Forecast, by Application (2021-2033)
12.3. APAC
12.3.1. Market Revenue and Forecast, by Component (2021-2033)
12.3.2. Market Revenue and Forecast, by Function (2021-2033)
12.3.3. Market Revenue and Forecast, by Technology (2021-2033)
12.3.4. Market Revenue and Forecast, by Application (2021-2033)
12.3.5. India
12.3.5.1. Market Revenue and Forecast, by Component (2021-2033)
12.3.5.2. Market Revenue and Forecast, by Function (2021-2033)
12.3.5.3. Market Revenue and Forecast, by Technology (2021-2033)
12.3.5.4. Market Revenue and Forecast, by Application (2021-2033)
12.3.6. China
12.3.6.1. Market Revenue and Forecast, by Component (2021-2033)
12.3.6.2. Market Revenue and Forecast, by Function (2021-2033)
12.3.6.3. Market Revenue and Forecast, by Technology (2021-2033)
12.3.6.4. Market Revenue and Forecast, by Application (2021-2033)
12.3.7. Japan
12.3.7.1. Market Revenue and Forecast, by Component (2021-2033)
12.3.7.2. Market Revenue and Forecast, by Function (2021-2033)
12.3.7.3. Market Revenue and Forecast, by Technology (2021-2033)
12.3.7.4. Market Revenue and Forecast, by Application (2021-2033)
12.3.8. Rest of APAC
12.3.8.1. Market Revenue and Forecast, by Component (2021-2033)
12.3.8.2. Market Revenue and Forecast, by Function (2021-2033)
12.3.8.3. Market Revenue and Forecast, by Technology (2021-2033)
12.3.8.4. Market Revenue and Forecast, by Application (2021-2033)
12.4. MEA
12.4.1. Market Revenue and Forecast, by Component (2021-2033)
12.4.2. Market Revenue and Forecast, by Function (2021-2033)
12.4.3. Market Revenue and Forecast, by Technology (2021-2033)
12.4.4. Market Revenue and Forecast, by Application (2021-2033)
12.4.5. GCC
12.4.5.1. Market Revenue and Forecast, by Component (2021-2033)
12.4.5.2. Market Revenue and Forecast, by Function (2021-2033)
12.4.5.3. Market Revenue and Forecast, by Technology (2021-2033)
12.4.5.4. Market Revenue and Forecast, by Application (2021-2033)
12.4.6. North Africa
12.4.6.1. Market Revenue and Forecast, by Component (2021-2033)
12.4.6.2. Market Revenue and Forecast, by Function (2021-2033)
12.4.6.3. Market Revenue and Forecast, by Technology (2021-2033)
12.4.6.4. Market Revenue and Forecast, by Application (2021-2033)
12.4.7. South Africa
12.4.7.1. Market Revenue and Forecast, by Component (2021-2033)
12.4.7.2. Market Revenue and Forecast, by Function (2021-2033)
12.4.7.3. Market Revenue and Forecast, by Technology (2021-2033)
12.4.7.4. Market Revenue and Forecast, by Application (2021-2033)
12.4.8. Rest of MEA
12.4.8.1. Market Revenue and Forecast, by Component (2021-2033)
12.4.8.2. Market Revenue and Forecast, by Function (2021-2033)
12.4.8.3. Market Revenue and Forecast, by Technology (2021-2033)
12.4.8.4. Market Revenue and Forecast, by Application (2021-2033)
12.5. Latin America
12.5.1. Market Revenue and Forecast, by Component (2021-2033)
12.5.2. Market Revenue and Forecast, by Function (2021-2033)
12.5.3. Market Revenue and Forecast, by Technology (2021-2033)
12.5.4. Market Revenue and Forecast, by Application (2021-2033)
12.5.5. Brazil
12.5.5.1. Market Revenue and Forecast, by Component (2021-2033)
12.5.5.2. Market Revenue and Forecast, by Function (2021-2033)
12.5.5.3. Market Revenue and Forecast, by Technology (2021-2033)
12.5.5.4. Market Revenue and Forecast, by Application (2021-2033)
12.5.6. Rest of LATAM
12.5.6.1. Market Revenue and Forecast, by Component (2021-2033)
12.5.6.2. Market Revenue and Forecast, by Function (2021-2033)
12.5.6.3. Market Revenue and Forecast, by Technology (2021-2033)
12.5.6.4. Market Revenue and Forecast, by Application (2021-2033)
Chapter 13. Company Profiles
13.1. Telefonaktiebolaget LM Ericsson
13.1.1. Company Overview
13.1.2. Product Offerings
13.1.3. Financial Performance
13.1.4. Recent Initiatives
13.2. Nokia
13.2.1. Company Overview
13.2.2. Product Offerings
13.2.3. Financial Performance
13.2.4. Recent Initiatives
13.3. Huawei Technologies Co., Ltd.
13.3.1. Company Overview
13.3.2. Product Offerings
13.3.3. Financial Performance
13.3.4. Recent Initiatives
13.4. ZTE Corporation
13.4.1. Company Overview
13.4.2. Product Offerings
13.4.3. Financial Performance
13.4.4. Recent Initiatives
13.5. SAMSUNG
13.5.1. Company Overview
13.5.2. Product Offerings
13.5.3. Financial Performance
13.5.4. Recent Initiatives
13.6. Cisco Systems, Inc.
13.6.1. Company Overview
13.6.2. Product Offerings
13.6.3. Financial Performance
13.6.4. Recent Initiatives
13.7. Juniper Networks, Inc.
13.7.1. Company Overview
13.7.2. Product Offerings
13.7.3. Financial Performance
13.7.4. Recent Initiatives
13.8. Mavenir
13.8.1. Company Overview
13.8.2. Product Offerings
13.8.3. Financial Performance
13.8.4. Recent Initiatives
13.9. Broadcom
13.9.1. Company Overview
13.9.2. Product Offerings
13.9.3. Financial Performance
13.9.4. Recent Initiatives
13.10. VIAVI Solutions Inc.
13.10.1. Company Overview
13.10.2. Product Offerings
13.10.3. Financial Performance
13.10.4. Recent Initiatives
Chapter 14. Research Methodology
14.1. Primary Research
14.2. Secondary Research
14.3. Assumptions
Chapter 15. Appendix
15.1. About Us
15.2. Glossary of Terms
 Cross-segment Market Size and Analysis for
Mentioned Segments
 Additional Company Profiles (Upto 5 With No Cost)
 Additional Countries (Apart From Mentioned Countries)
 Country/Region-specific Report
 Go To Market Strategy
 Region Specific Market Dynamics
 Region Level Market Share
 Import Export Analysis
 Production Analysis
 Others