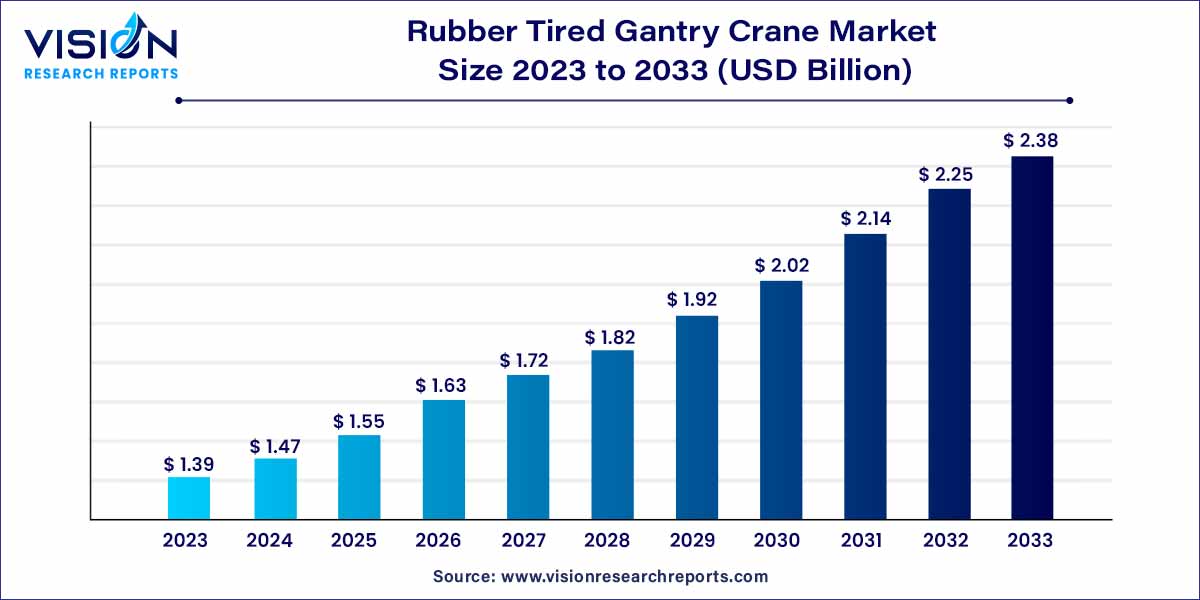
The global rubber tired gantry crane market was estimated at USD 1.39 billion in 2023 and it is expected to surpass around USD 2.38 billion by 2033, poised to grow at a CAGR of 5.52% from 2024 to 2033. Many benefits, including reduced operating costs and technological developments, are anticipated to encourage the use of rubber-tired gantry cranes. Automation and wireless communication are examples of technologies that help the market achieve operational efficiencies.

The growth of the rubber tired gantry crane (RTG crane) market is propelled by several key factors. Firstly, the expanding global trade and increasing container traffic have heightened the demand for efficient and flexible container handling solutions, positioning RTG cranes as vital contributors to this evolving landscape. Secondly, the ongoing advancements in technology, including automation and smart integration, are driving innovation within the RTG crane sector. As industries increasingly focus on optimizing operational efficiency, the adoption of these technological trends has become instrumental in meeting the evolving needs of modern logistics. Furthermore, the growing emphasis on environmental sustainability has led to the development of eco-friendly solutions in the RTG crane market, attracting environmentally conscious industries. These growth factors collectively contribute to the expansion of the RTG crane market, offering stakeholders lucrative opportunities in a dynamic and evolving industry.
| Report Coverage | Details |
| Market Revenue by 2033 | USD 2.38 billion |
| Growth Rate from 2024 to 2033 | CAGR of 5.52% |
| Revenue Share of North America in 2023 | 41% |
| Base Year | 2023 |
| Forecast Period | 2023 to 2032 |
| Market Analysis (Terms Used) | Value (US$ Million/Billion) or (Volume/Units) |
The 16-wheeler RTG segment dominated the market with a revenue share of 63% in 2023. The low maintenance costs incurred due to the low cost of spare parts are a significant factor in the growth of these cranes. Moreover, many wheels lead to convenient maneuverability and increased driver safety.
The 8-wheeler RTC segment is expected to expand significantly from 2024 to 2033. The growth is attributed to its design and features, making it suitable for various applications and industries, including container terminals, intermodal yards, and industrial facilities. The crane's ability to efficiently handle heavy loads and maneuver in tight spaces contributes to its increased demand. Additionally, the flexibility and mobility provided by the rubber tires allow for easy movement and positioning of the crane, making it a versatile choice for different working environments.
Diesel-powered RTG led the global market with a revenue share of 56% in 2023. This growth is attributed to the high power and torque, long operating range, established infrastructure & support system, and lower initial investment costs. These factors have made them reliable and preferred for applications requiring heavy lifting and continuous operation. However, with an increasing focus on environmental sustainability, the market is likely to see a shift toward alternative power sources, such as electric or hybrid RTGs, in the future.
Electric RTG is anticipated to be the fastest-growing segment registering a CAGR of 7.83% over the forecast period. Electric RTGs reduce the need for engine component maintenance. They can save up to 600 liters of engine oil per year. They have lower maintenance costs and reduced downtime. Regions like Europe, where the government has imposed strict air pollution and emission control regulations, have witnessed increased adoption of electric RTGs. They help reduce company expenses by eliminating hydraulic and engine oil usage.
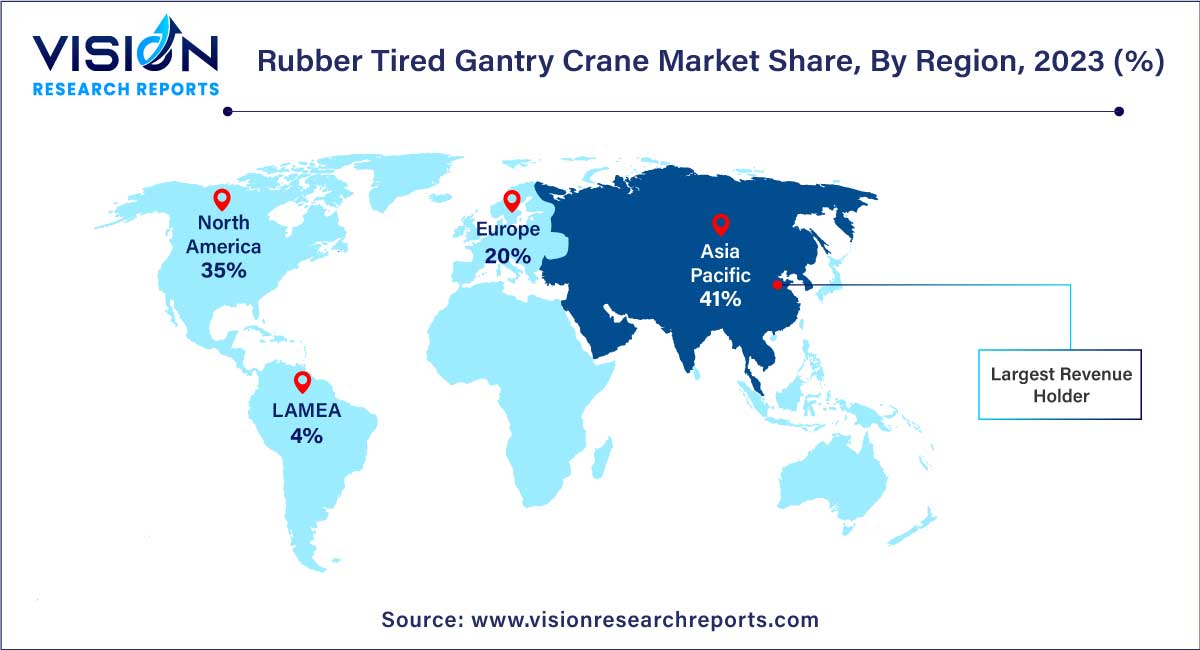
Asia Pacific is the leading region with a market share of 41% in 2023. Regions such as the Asia Pacific have witnessed a surge in inter-regional trade due to increased exports, mainly from China and India. It has enabled the regional government to invest in developing port infrastructure to manage incoming and outgoing container traffic. Furthermore, governments in various regions are inclined toward port expansion.

Europe is expected to witness significant growth in this market from 2024 to 2033. Ports in Europe have adopted electric RTGs to reduce pollution and greenhouse gas emissions. Government regulations, such as verifying carbon emissions in maritime transportation, have enabled electric container handling equipment adoption. Furthermore, financial transparency regarding port investments has enabled port authorities to invest in port infrastructure strategically.
In January 2023, Kuenz, an Austrian crane manufacturer, won a major contract to deliver 20 sideloaded stacking automated cranes for Baltic Hub's new T3 terminal, which is now under construction, in partnership with systems integrator ABB. A strategically significant terminal in the Baltic Sea, Baltic Hub is home to the well-known worldwide port organization PSA. It is expanding quickly. The long-standing cooperation between Kuenz and PSA was strengthened and extended by the deal, which was finalized in September 2022.
A contract for the acquisition of five PACECO-MITSUI RTG Transtainer Cranes and five recently built 65 Long Ton capacity PACECO-MITSUI Ship to Shore Portainer Cranes was given to PACECO CORP by ITS in January 2022. It was intended for these cranes to be installed at the Long Beach, California, terminal as part of an extensive refurbishment and capacity expansion project. Enhancing the terminal's ability to accommodate larger vessels—which can hold up to 24,000 TEUs and 25 containers wide—is the goal.
By Type
By Power Supply
By Region
Chapter 1. Introduction
1.1. Research Objective
1.2. Scope of the Study
1.3. Definition
Chapter 2. Research Methodology
2.1. Research Approach
2.2. Data Sources
2.3. Assumptions & Limitations
Chapter 3. Executive Summary
3.1. Market Snapshot
Chapter 4. Market Variables and Scope
4.1. Introduction
4.2. Market Classification and Scope
4.3. Industry Value Chain Analysis
4.3.1. Raw Material Procurement Analysis
4.3.2. Sales and Distribution Channel Analysis
4.3.3. Downstream Buyer Analysis
Chapter 5. COVID 19 Impact on Rubber Tired Gantry Crane Market
5.1. COVID-19 Landscape: Rubber Tired Gantry Crane Industry Impact
5.2. COVID 19 - Impact Assessment for the Industry
5.3. COVID 19 Impact: Global Major Government Policy
5.4. Market Trends and Opportunities in the COVID-19 Landscape
Chapter 6. Market Dynamics Analysis and Trends
6.1. Market Dynamics
6.1.1. Market Drivers
6.1.2. Market Restraints
6.1.3. Market Opportunities
6.2. Porter’s Five Forces Analysis
6.2.1. Bargaining power of suppliers
6.2.2. Bargaining power of buyers
6.2.3. Threat of substitute
6.2.4. Threat of new entrants
6.2.5. Degree of competition
Chapter 7. Competitive Landscape
7.1.1. Company Market Share/Positioning Analysis
7.1.2. Key Strategies Adopted by Players
7.1.3. Vendor Landscape
7.1.3.1. List of Suppliers
7.1.3.2. List of Buyers
Chapter 8. Global Rubber Tired Gantry Crane Market, By Type
8.1. Rubber Tired Gantry Crane Market, by Type, 2024-2033
8.1.1. 8 Wheel
8.1.1.1. Market Revenue and Forecast (2021-2033)
8.1.2. 16 Wheel
8.1.2.1. Market Revenue and Forecast (2021-2033)
Chapter 9. Global Rubber Tired Gantry Crane Market, By Power Supply
9.1. Rubber Tired Gantry Crane Market, by Power Supply, 2024-2033
9.1.1. Diesel
9.1.1.1. Market Revenue and Forecast (2021-2033)
9.1.2. Electric
9.1.2.1. Market Revenue and Forecast (2021-2033)
9.1.3. Hybrid
9.1.3.1. Market Revenue and Forecast (2021-2033)
Chapter 10. Global Rubber Tired Gantry Crane Market, Regional Estimates and Trend Forecast
10.1. North America
10.1.1. Market Revenue and Forecast, by Type (2021-2033)
10.1.2. Market Revenue and Forecast, by Power Supply (2021-2033)
10.1.3. U.S.
10.1.3.1. Market Revenue and Forecast, by Type (2021-2033)
10.1.3.2. Market Revenue and Forecast, by Power Supply (2021-2033)
10.1.4. Rest of North America
10.1.4.1. Market Revenue and Forecast, by Type (2021-2033)
10.1.4.2. Market Revenue and Forecast, by Power Supply (2021-2033)
10.2. Europe
10.2.1. Market Revenue and Forecast, by Type (2021-2033)
10.2.2. Market Revenue and Forecast, by Power Supply (2021-2033)
10.2.3. UK
10.2.3.1. Market Revenue and Forecast, by Type (2021-2033)
10.2.3.2. Market Revenue and Forecast, by Power Supply (2021-2033)
10.2.4. Germany
10.2.4.1. Market Revenue and Forecast, by Type (2021-2033)
10.2.4.2. Market Revenue and Forecast, by Power Supply (2021-2033)
10.2.5. France
10.2.5.1. Market Revenue and Forecast, by Type (2021-2033)
10.2.5.2. Market Revenue and Forecast, by Power Supply (2021-2033)
10.2.6. Rest of Europe
10.2.6.1. Market Revenue and Forecast, by Type (2021-2033)
10.2.6.2. Market Revenue and Forecast, by Power Supply (2021-2033)
10.3. APAC
10.3.1. Market Revenue and Forecast, by Type (2021-2033)
10.3.2. Market Revenue and Forecast, by Power Supply (2021-2033)
10.3.3. India
10.3.3.1. Market Revenue and Forecast, by Type (2021-2033)
10.3.3.2. Market Revenue and Forecast, by Power Supply (2021-2033)
10.3.4. China
10.3.4.1. Market Revenue and Forecast, by Type (2021-2033)
10.3.4.2. Market Revenue and Forecast, by Power Supply (2021-2033)
10.3.5. Japan
10.3.5.1. Market Revenue and Forecast, by Type (2021-2033)
10.3.5.2. Market Revenue and Forecast, by Power Supply (2021-2033)
10.3.6. Rest of APAC
10.3.6.1. Market Revenue and Forecast, by Type (2021-2033)
10.3.6.2. Market Revenue and Forecast, by Power Supply (2021-2033)
10.4. MEA
10.4.1. Market Revenue and Forecast, by Type (2021-2033)
10.4.2. Market Revenue and Forecast, by Power Supply (2021-2033)
10.4.3. GCC
10.4.3.1. Market Revenue and Forecast, by Type (2021-2033)
10.4.3.2. Market Revenue and Forecast, by Power Supply (2021-2033)
10.4.4. North Africa
10.4.4.1. Market Revenue and Forecast, by Type (2021-2033)
10.4.4.2. Market Revenue and Forecast, by Power Supply (2021-2033)
10.4.5. South Africa
10.4.5.1. Market Revenue and Forecast, by Type (2021-2033)
10.4.5.2. Market Revenue and Forecast, by Power Supply (2021-2033)
10.4.6. Rest of MEA
10.4.6.1. Market Revenue and Forecast, by Type (2021-2033)
10.4.6.2. Market Revenue and Forecast, by Power Supply (2021-2033)
10.5. Latin America
10.5.1. Market Revenue and Forecast, by Type (2021-2033)
10.5.2. Market Revenue and Forecast, by Power Supply (2021-2033)
10.5.3. Brazil
10.5.3.1. Market Revenue and Forecast, by Type (2021-2033)
10.5.3.2. Market Revenue and Forecast, by Power Supply (2021-2033)
10.5.4. Rest of LATAM
10.5.4.1. Market Revenue and Forecast, by Type (2021-2033)
10.5.4.2. Market Revenue and Forecast, by Power Supply (2021-2033)
Chapter 11. Company Profiles
11.1. Anupam Industries Limited
11.1.1. Company Overview
11.1.2. Product Offerings
11.1.3. Financial Performance
11.1.4. Recent Initiatives
11.2. ELECTROMECH MATERIAL HANDLING SYSTEMS (INDIA) PVT. LTD.
11.2.1. Company Overview
11.2.2. Product Offerings
11.2.3. Financial Performance
11.2.4. Recent Initiatives
11.3. Cargotec
11.3.1. Company Overview
11.3.2. Product Offerings
11.3.3. Financial Performance
11.3.4. Recent Initiatives
11.4. Konecranes
11.4.1. Company Overview
11.4.2. Product Offerings
11.4.3. Financial Performance
11.4.4. LTE Scientific
11.5. Liebherr-International Deutschland GmbH
11.5.1. Company Overview
11.5.2. Product Offerings
11.5.3. Financial Performance
11.5.4. Recent Initiatives
11.6. Mi-Jack
11.6.1. Company Overview
11.6.2. Product Offerings
11.6.3. Financial Performance
11.6.4. Recent Initiatives
11.7. Reva Industries Limited
11.7.1. Company Overview
11.7.2. Product Offerings
11.7.3. Financial Performance
11.7.4. Recent Initiatives
11.8. SANY Group
11.8.1. Company Overview
11.8.2. Product Offerings
11.8.3. Financial Performance
11.8.4. Recent Initiatives
11.9. Shanghai Zhenhua Heavy Industries Co., Ltd.
11.9.1. Company Overview
11.9.2. Product Offerings
11.9.3. Financial Performance
11.9.4. Recent Initiatives
11.10. TNT Crane & Rigging
11.10.1. Company Overview
11.10.2. Product Offerings
11.10.3. Financial Performance
11.10.4. Recent Initiatives
Chapter 12. Research Methodology
12.1. Primary Research
12.2. Secondary Research
12.3. Assumptions
Chapter 13. Appendix
13.1. About Us
13.2. Glossary of Terms
 Cross-segment Market Size and Analysis for
Mentioned Segments
 Additional Company Profiles (Upto 5 With No Cost)
 Additional Countries (Apart From Mentioned Countries)
 Country/Region-specific Report
 Go To Market Strategy
 Region Specific Market Dynamics
 Region Level Market Share
 Import Export Analysis
 Production Analysis
 Others