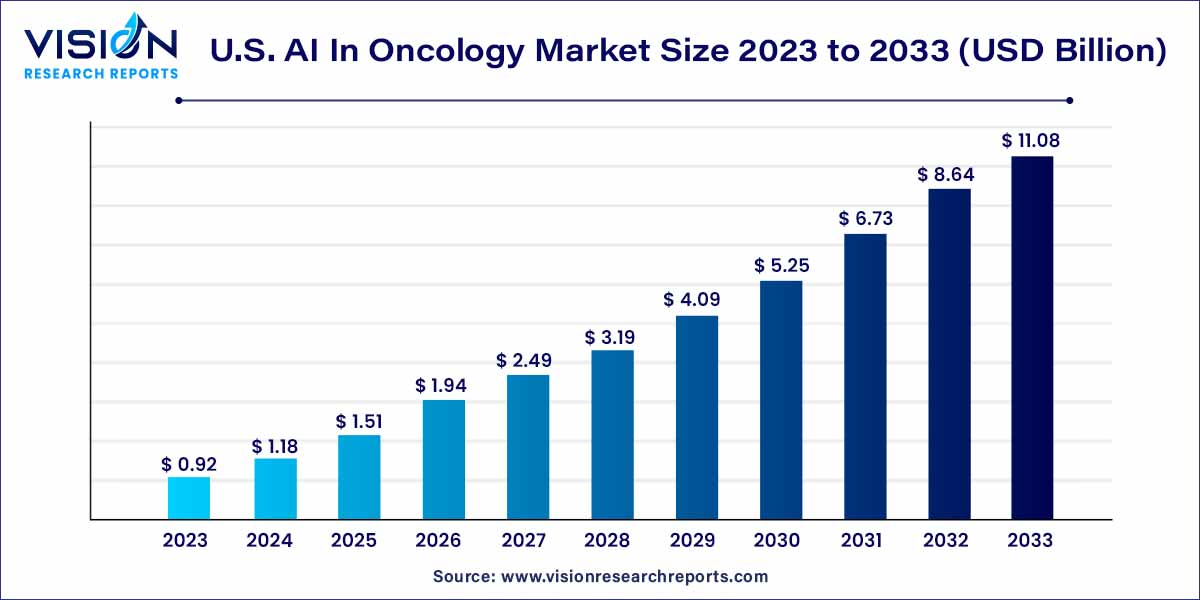
The U.S. AI in oncology market size was estimated at around USD 0.92 billion in 2023 and it is projected to hit around USD 11.08 billion by 2033, growing at a CAGR of 28.25% from 2024 to 2033. The U.S. AI in oncology market is driven by an increasing cancer incidence, enhanced diagnostics, personalized treatment approaches, clinical trials acceleration, and real-time patient monitoring.

The landscape of oncology care in the United States is undergoing a transformative shift, driven by the integration of Artificial Intelligence (AI) technologies. As the healthcare sector embraces innovation, AI in oncology emerges as a pivotal force, promising advancements in diagnostics, treatment optimization, and overall patient care. This overview delves into the key facets of the U.S. AI in Oncology market, exploring its current status, trends, and future potential.
The growth of the U.S. AI in oncology market is underpinned by various factors contributing to its upward trajectory. Firstly, the increasing incidence of cancer cases necessitates innovative solutions, and AI presents a powerful tool for enhanced diagnostics and personalized treatment strategies. The integration of machine learning algorithms into the analysis of diverse datasets enables swift and accurate cancer detection, thereby improving patient outcomes. Additionally, the trend towards treatment personalization, where AI assists in predicting individual patient responses and optimizing therapeutic approaches, is a significant growth factor. The optimization of clinical trials through AI-driven patient selection expedites the development of new oncology treatments, fostering further market expansion. Real-time monitoring capabilities offered by AI contribute to proactive healthcare interventions, further fueling the market's growth.
In 2023, hardware emerged as the dominant component in the market, holding a substantial revenue share of 40%, and its supremacy is anticipated to persist throughout the forecast period. AI hardware encompasses physical components and systems specifically designed to meet the computational requirements of AI algorithms. Within this category, crucial components like medical linear accelerators, vital for radiotherapy in oncology, are included. For instance, Varian's Ethos therapy, an AI-powered adaptive radiotherapy treatment system featuring a linear accelerator, received regulatory clearances in 2019 and 2020. Ethos therapy enhances radiotherapy by offering adaptive treatments within a concise 15-minute timeframe.
Furthermore, the rising need for hardware platforms with substantial computing power to operate AI-based software contributes significantly to the growth of this segment. The software solutions segment is projected to experience the fastest Compound Annual Growth Rate (CAGR) from 2024 to 2033. This surge is attributed to the widespread adoption of AI software solutions by healthcare providers and payers involved in oncology. The utilization of software solutions proves highly effective in predicting various types of cancer, such as brain, breast, liver, lung, and prostate cancer, offering superior accuracy compared to clinicians.
In 2023, the "others" segment claimed the largest share of revenue at 26% and is expected to exhibit a lucrative Compound Annual Growth Rate (CAGR) from 2024 to 2033. This segment's dominance is primarily driven by the increasing prevalence of kidney cancer, which ranks among the top 10 types of cancer globally, as reported by the Global Cancer Observatory. Contributing factors to kidney cancer include inherited syndromes, high blood pressure, obesity, smoking, old age, long-term dialysis, and a family history of kidney cancer. Common diagnostic techniques involve blood tests and imaging procedures like CT scans, Magnetic Resonance Imaging (MRI), and ultrasound. Additionally, awareness programs initiated by public and private organizations to enhance understanding of kidney cancer are expected to bolster market growth.
The prostate cancer segment is poised to exhibit the fastest CAGR from 2024 to 2033. Prostate cancer affects around 13 out of every 100 men in the U.S., according to CDC data. In 2023, the National Cancer Institute reported approximately 288,300 new cases of prostate cancer. Risk factors for prostate cancer include age, family history, diet, smoking, obesity, chemical exposure, and vasectomy. Obesity, in particular, significantly impacts men with advanced and aggressive forms of prostate cancer. Certain studies also suggest that obesity is associated with a higher likelihood of mortality in prostate cancer cases.
In 2023, the diagnostics segment emerged as the market leader, commanding a substantial revenue share of 38%. Cancer diagnostics, a crucial starting point for formulating relevant therapeutic strategies and clinical management, has witnessed enhanced efficiency and effectiveness through AI advancements. The intersection of early cancer diagnosis and AI represents a rapidly evolving domain with significant synergies. Detecting cancer at its initial stages significantly enhances the potential for delivering effective treatment across various tumor groups. Consequently, several companies are actively developing approaches for early diagnosis, encompassing the screening of at-risk patients without symptoms and promptly investigating those exhibiting symptoms.
The research and development segment is poised to exhibit the fastest Compound Annual Growth Rate (CAGR) from 2024 to 2033. This is attributed to the increasing adoption of AI by modern pharmaceutical companies to expedite and enhance various facets of clinical development. AI holds immense potential in assisting pharmaceutical corporations in bringing medications to market. Beyond its gene-sequencing capabilities, AI is undergoing training to predict drug effectiveness and anticipate potential adverse reactions..
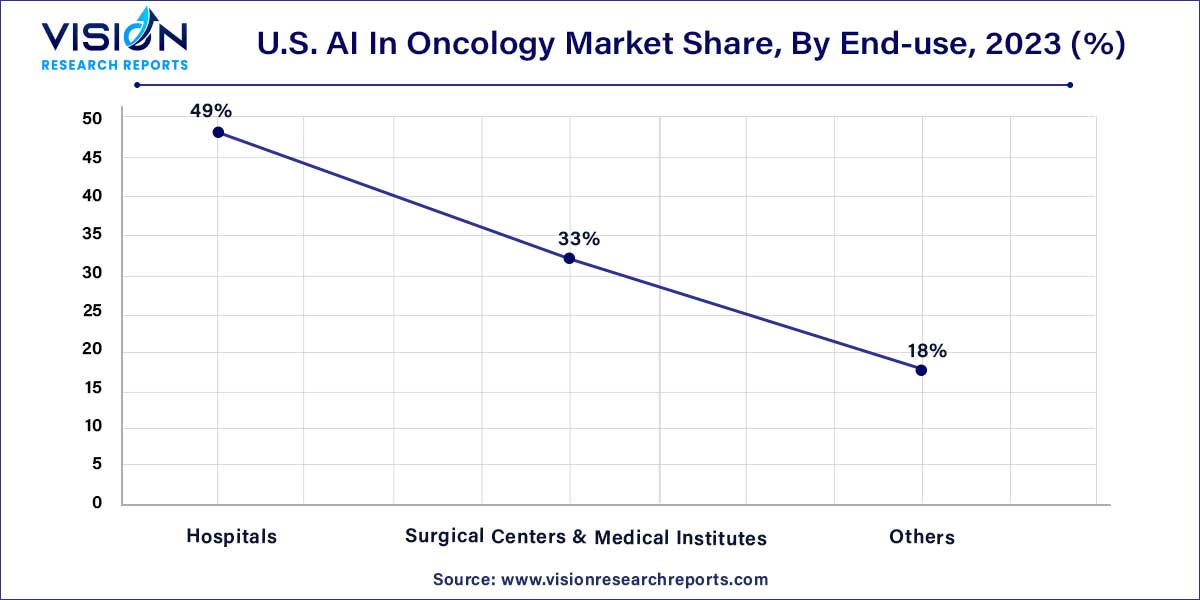
In 2023, the hospitals segment emerged as the market leader, capturing a substantial revenue share of 49%. This dominance is attributed to the escalating demand for AI applications, driving a transformative shift in medicine and advancing research, diagnostics, and cancer treatment. Notably, the hospitals segment's rapid adoption of AI in pathology solutions, particularly for cancer diagnostics, stands out as a significant market driver. Projected to grow at the fastest Compound Annual Growth Rate (CAGR) from 2024 to 2033, this segment reflects the increasing embrace of AI-powered solutions within hospital settings.

The market is anticipated to receive additional impetus from the entry of numerous companies focusing on cancer care in hospitals. Positive responses from patients further contribute to the segment's growth during the forecast period. Disturbingly, AI Multiple reports indicate that around 12 million individuals in the U.S. experience misdiagnosis, with 44% misdiagnosed with cancer. Breast cancer, prostate cancer, and thyroid cancer top the list of most misdiagnosed cancers.
By Component Type
By Cancer Type
By Application
By End-use
Chapter 1. Introduction
1.1. Research Objective
1.2. Scope of the Study
1.3. Definition
Chapter 2. Research Methodology
2.1. Research Approach
2.2. Data Sources
2.3. Assumptions & Limitations
Chapter 3. Executive Summary
3.1. Market Snapshot
Chapter 4. Market Variables and Scope
4.1. Introduction
4.2. Market Classification and Scope
4.3. Industry Value Chain Analysis
4.3.1. Raw Material Procurement Analysis
4.3.2. Sales and Distribution Channel Analysis
4.3.3. Downstream Buyer Analysis
Chapter 5. COVID 19 Impact on U.S. AI In Oncology Market
5.1. COVID-19 Landscape: U.S. AI In Oncology Industry Impact
5.2. COVID 19 - Impact Assessment for the Industry
5.3. COVID 19 Impact: Global Major Government Policy
5.4. Market Trends and Opportunities in the COVID-19 Landscape
Chapter 6. Market Dynamics Analysis and Trends
6.1. Market Dynamics
6.1.1. Market Drivers
6.1.2. Market Restraints
6.1.3. Market Opportunities
6.2. Porter’s Five Forces Analysis
6.2.1. Bargaining power of suppliers
6.2.2. Bargaining power of buyers
6.2.3. Threat of substitute
6.2.4. Threat of new entrants
6.2.5. Degree of competition
Chapter 7. Competitive Landscape
7.1.1. Company Market Share/Positioning Analysis
7.1.2. Key Strategies Adopted by Players
7.1.3. Vendor Landscape
7.1.3.1. List of Suppliers
7.1.3.2. List of Buyers
Chapter 8. Global U.S. AI In Oncology Market, By Component Type
8.1. U.S. AI In Oncology Market, by Component Type, 2024-2033
8.1.1. Software Solutions
8.1.1.1. Market Revenue and Forecast (2021-2033)
8.1.2. Hardware
8.1.2.1. Market Revenue and Forecast (2021-2033)
8.1.3. Services
8.1.3.1. Market Revenue and Forecast (2021-2033)
Chapter 9. U.S. AI In Oncology Market, By Cancer Type
9.1. U.S. AI In Oncology Market, by Cancer Type, 2024-2033
9.1.1. Breast Cancer
9.1.1.1. Market Revenue and Forecast (2021-2033)
9.1.2. Lung Cancer
9.1.2.1. Market Revenue and Forecast (2021-2033)
9.1.3. Prostate Cancer
9.1.3.1. Market Revenue and Forecast (2021-2033)
9.1.4. Colorectal Cancer
9.1.4.1. Market Revenue and Forecast (2021-2033)
9.1.5. Brain Tumor
9.1.5.1. Market Revenue and Forecast (2021-2033)
9.1.6. Others
9.1.6.1. Market Revenue and Forecast (2021-2033)
Chapter 10. U.S. AI In Oncology Market, By Application
10.1. U.S. AI In Oncology Market, by Application, 2024-2033
10.1.1. Diagnostics
10.1.1.1. Market Revenue and Forecast (2021-2033)
10.1.2. Radiation Therapy
10.1.2.1. Market Revenue and Forecast (2021-2033)
10.1.3. Research & Development
10.1.3.1. Market Revenue and Forecast (2021-2033)
10.1.4. Chemotherapy
10.1.4.1. Market Revenue and Forecast (2021-2033)
10.1.5. Immunotherapy
10.1.5.1. Market Revenue and Forecast (2021-2033)
Chapter 11. U.S. AI In Oncology Market, By End-use
11.1. U.S. AI In Oncology Market, by End-use, 2024-2033
11.1.1. Hospitals
11.1.1.1. Market Revenue and Forecast (2021-2033)
11.1.2. Surgical Centers & Medical Institutes
11.1.2.1. Market Revenue and Forecast (2021-2033)
11.1.3. Others
11.1.3.1. Market Revenue and Forecast (2021-2033)
Chapter 12. U.S. AI In Oncology Market, Regional Estimates and Trend Forecast
12.1. U.S.
12.1.1. Market Revenue and Forecast, by Component Type (2021-2033)
12.1.2. Market Revenue and Forecast, by Cancer Type (2021-2033)
12.1.3. Market Revenue and Forecast, by Application (2021-2033)
12.1.4. Market Revenue and Forecast, by End-use (2021-2033)
Chapter 13. Company Profiles
13.1. Azra AI
13.1.1. Company Overview
13.1.2. Product Offerings
13.1.3. Financial Performance
13.1.4. Recent Initiatives
13.2. iCAD, Inc.
13.2.1. Company Overview
13.2.2. Product Offerings
13.2.3. Financial Performance
13.2.4. Recent Initiatives
13.3. IBM
13.3.1. Company Overview
13.3.2. Product Offerings
13.3.3. Financial Performance
13.3.4. Recent Initiatives
13.4. Siemens Healthcare GmbH
13.4.1. Company Overview
13.4.2. Product Offerings
13.4.3. Financial Performance
13.4.4. Recent Initiatives
13.5. Intel Corporation
13.5.1. Company Overview
13.5.2. Product Offerings
13.5.3. Financial Performance
13.5.4. Recent Initiatives
13.6. GE HealthCare
13.6.1. Company Overview
13.6.2. Product Offerings
13.6.3. Financial Performance
13.6.4. Recent Initiatives
13.7. NVIDIA Corporation
13.7.1. Company Overview
13.7.2. Product Offerings
13.7.3. Financial Performance
13.7.4. Recent Initiatives
13.8. Digital Diagnostics Inc.
13.8.1. Company Overview
13.8.2. Product Offerings
13.8.3. Financial Performance
13.8.4. Recent Initiatives
13.9. ConcertAI
13.9.1. Company Overview
13.9.2. Product Offerings
13.9.3. Financial Performance
13.9.4. Recent Initiatives
13.10. Median Technologies
13.10.1. Company Overview
13.10.2. Product Offerings
13.10.3. Financial Performance
13.10.4. Recent Initiatives
Chapter 14. Research Methodology
14.1. Primary Research
14.2. Secondary Research
14.3. Assumptions
Chapter 15. Appendix
15.1. About Us
15.2. Glossary of Terms
 Cross-segment Market Size and Analysis for
Mentioned Segments
 Additional Company Profiles (Upto 5 With No Cost)
 Additional Countries (Apart From Mentioned Countries)
 Country/Region-specific Report
 Go To Market Strategy
 Region Specific Market Dynamics
 Region Level Market Share
 Import Export Analysis
 Production Analysis
 Others