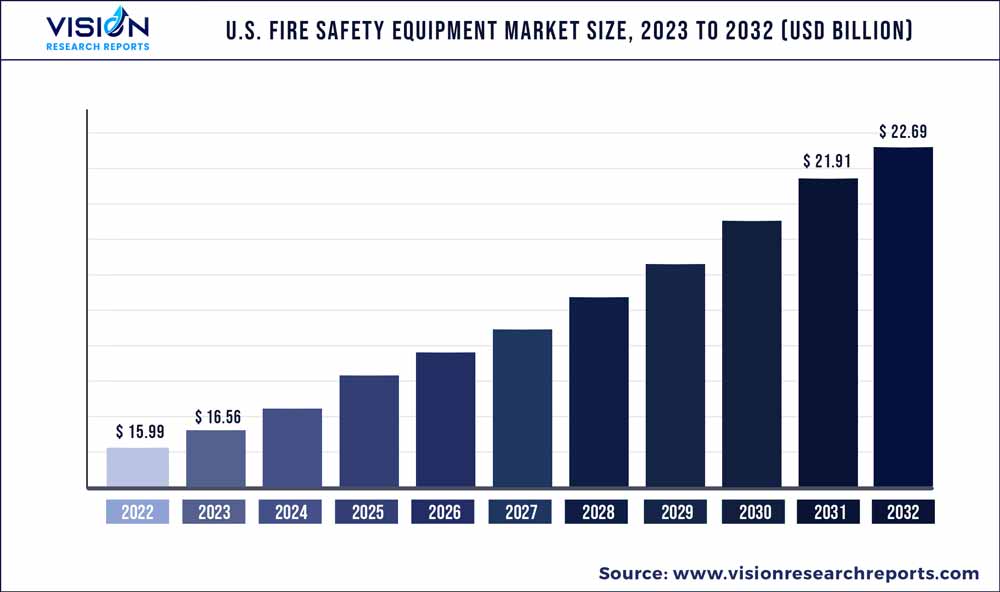
The U.S. fire safety equipment market size was estimated at around USD 15.99 billion in 2022 and it is projected to hit around USD 22.69 billion by 2032, growing at a CAGR of 3.56% from 2023 to 2032.

Key Pointers
Report Scope of the U.S. Fire Safety Equipment Market
| Report Coverage | Details |
| Market Size in 2022 | USD 15.99 billion |
| Revenue Forecast by 2032 | USD 22.69 billion |
| Growth rate from 2023 to 2032 | CAGR of 3.56% |
| Base Year | 2022 |
| Forecast Period | 2023 to 2032 |
| Market Analysis (Terms Used) | Value (US$ Million/Billion) or (Volume/Units) |
| Companies Covered | Eaton Corp., Inc.; Gentex Corp.; Halmaplc; Hochiki Corp.; Honeywell International, Inc.; Johnson Controls; Napco Security Technologies, Inc.; Nittan Company, Ltd.; Robert Bosch GmbH; Siemens Building Technologies; Space Age Electronics; United Technologies Corp |
The construction industry is a primary factor driving the market growth, as new buildings are equipped with fire safety systems to comply with building codes and regulations. The industry witnessed a significant boom in recent years, fueled by infrastructure projects, commercial developments, and residential construction. With increased construction activity, the risk of fire incidents also escalates. Flammable materials, electrical wiring, and combustible gases at construction sites pose a considerable fire hazard. This heightened risk necessitates the adoption of robust fire safety measures, driving the demand for fire safety equipment.
Fire safety has become increasingly important in the U.S. in recent years owing to incidents such as the Station nightclub fire in West Warwick and the Ghost Ship warehouse fire in Oakland. For instance, in 2020, according to the National Fire Protection Association (NFPA), an estimated 1,291,500 fire cases were reported in the U.S., which caused 3,420 civilian deaths, 16,720 civilian injuries, and USD 14.8 billion in property damage. This increasing incidence of fire is resulting in the deployment of fire alarms and detectors in commercial and industrial spaces, a major factor expected to drive the growth of the U.S. fire safety equipment market.
Stringent government regulations about installing fire safety equipment such as fire alarms and sprinkler systems in residential and commercial spaces as they aid in protection against fire hazards are another important factor anticipated to impact the target market's growth positively. For instance, the NFPA has established nearly 300 codes and standards for installing and maintaining fire safety equipment, which insurance companies and local governments use to enforce fire safety regulations. These codes provide specific fire safety guidelines, including installing, inspecting, and maintaining fire alarm systems. Compliance with these regulations is mandatory, ensuring that buildings prioritize fire safety.
However, the U.S. fire safety equipment market is highly competitive, with numerous manufacturers and suppliers vying for market share. This intense competition generates price challenges as customers demand cost-effective solutions that do not compromise quality and dependability. As a result, manufacturers encounter the difficulty of achieving a delicate equilibrium between cost-efficiency and upholding stringent product standards and safety attributes. Moreover, escalating expenses for raw materials, labor, and compliance impose additional financial burdens on players within the sector.
As building owners and managers recognize the importance of fire safety, they are increasingly investing in upgrading their facilities to comply with modern safety standards. Integration with building automation systems allows for seamless fire safety system monitoring, control, and coordination. This integration streamlines operations, improves response times, and enhances overall safety. Companies that offer interoperable solutions and facilitate integration with smart building platforms can gain a competitive edge in the market. As a result, retrofitting projects and the rise of smart buildings is expected to provide significant growth opportunity for the U.S. market for fire safety equipment.
Solution Insights
The fire detection segment accounted for the largest market share of over 60% in 2022 and is expected to hold the highest CAGR over the forecast period. The segment’s growth is primarily driven by regulations and standards set by government agencies and organizations and technological advancements.
Fire detectors are typically more commonly installed in the U.S. than fire alarms because they can detect smoke or heat early on and alert people before a fire spreads. However, fire alarms are often cheaper than fire detectors, making them more accessible to a wider range of customers. This can be particularly important in residential settings where homeowners may be more cost-sensitive in forthcoming years.
The fire suppression segment is anticipated to register considerable growth over the forecast period. Federal, state, and local governments have regulations and policies in place to help prevent and suppress fires. These policies include building codes that require fire-resistant materials and sprinkler systems, restrictions on burning and other fire-related activities, and regulations on how and where fires can be lit.
Fire sprinkler systems are typically installed in buildings to provide automatic fire protection. They consist of a network of pipes and sprinkler heads that are designed to activate when they detect heat or flames. When activated, the sprinklers spray water or other fire suppression agents onto the fire, helping to extinguish it and prevent it from spreading. Hence, such factors are expected to drive the segment growth over the forecast period.
Application Insights
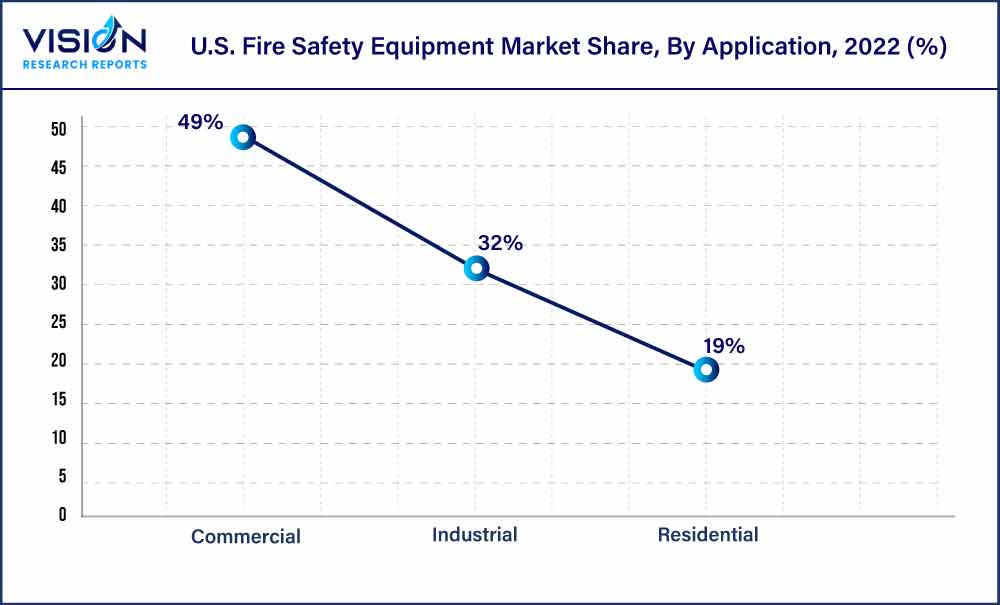
The commercial segment accounted for the largest market share of over 49% in 2022. Commercial sectors such as offices, hospitals, and shopping malls are increasing the adoption of fire safety equipment. The commercial sector in the U.S. is experiencing robust growth driven by factors such as economic development, increased consumer spending, and technological advancements.
Effective fire protection systems become essential as businesses expand their operations, construct new facilities, or renovate existing spaces. These systems help prevent fires, detect potential hazards, and enable swift evacuation, minimizing property damage and ensuring occupants' safety. These systems were primarily used in commercial buildings, such as offices, hospitals, and shopping malls. Hence, such factors are anticipated to drive the segment growth.

The residential segment is expected to register the highest CAGR over the forecast period. Homeowners are increasingly aware of the devastating impact that fires can have on their homes and their families, and as a result, they are taking proactive steps to protect themselves and their loved ones.
Another key driver of the market is the increasing demand for connected fire safety systems. These systems integrate smoke detectors, carbon monoxide detectors, and other fire safety equipment with smart home technology, allowing homeowners to monitor and control their fire safety systems remotely. This particularly appeals to busy homeowners who want to protect their homes even when they are away.
U.S. Fire Safety Equipment Market Segmentations:
By Solution
By Application
Chapter 1. Introduction
1.1. Research Objective
1.2. Scope of the Study
1.3. Definition
Chapter 2. Research Methodology
2.1. Research Approach
2.2. Data Sources
2.3. Assumptions & Limitations
Chapter 3. Executive Summary
3.1. Market Snapshot
Chapter 4. Market Variables and Scope
4.1. Introduction
4.2. Market Classification and Scope
4.3. Industry Value Chain Analysis
4.3.1. Raw Material Procurement Analysis
4.3.2. Sales and Distribution Channel Analysis
4.3.3. Downstream Buyer Analysis
Chapter 5. COVID 19 Impact on U.S. Fire Safety Equipment Market
5.1. COVID-19 Landscape: U.S. Fire Safety Equipment Industry Impact
5.2. COVID 19 - Impact Assessment for the Industry
5.3. COVID 19 Impact: Major Government Policy
5.4. Market Trends and Opportunities in the COVID-19 Landscape
Chapter 6. Market Dynamics Analysis and Trends
6.1. Market Dynamics
6.1.1. Market Drivers
6.1.2. Market Restraints
6.1.3. Market Opportunities
6.2. Porter’s Five Forces Analysis
6.2.1. Bargaining power of suppliers
6.2.2. Bargaining power of buyers
6.2.3. Threat of substitute
6.2.4. Threat of new entrants
6.2.5. Degree of competition
Chapter 7. Competitive Landscape
7.1.1. Company Market Share/Positioning Analysis
7.1.2. Key Strategies Adopted by Players
7.1.3. Vendor Landscape
7.1.3.1. List of Suppliers
7.1.3.2. List of Buyers
Chapter 8. U.S. Fire Safety Equipment Market, By Solution
8.1. U.S. Fire Safety Equipment Market, by Solution, 2023-2032
8.1.1. Fire Detection
8.1.1.1. Market Revenue and Forecast (2020-2032)
8.1.2. Alarms
8.1.2.1. Market Revenue and Forecast (2020-2032)
8.1.3. Fire Suppression
8.1.3.1. Market Revenue and Forecast (2020-2032)
Chapter 9. U.S. Fire Safety Equipment Market, By Application
9.1. U.S. Fire Safety Equipment Market, by Application, 2023-2032
9.1.1. Commercial
9.1.1.1. Market Revenue and Forecast (2020-2032)
9.1.2. Industrial
9.1.2.1. Market Revenue and Forecast (2020-2032)
9.1.3. Residential
9.1.3.1. Market Revenue and Forecast (2020-2032)
Chapter 10. U.S. Fire Safety Equipment Market, Regional Estimates and Trend Forecast
10.1. U.S.
10.1.1. Market Revenue and Forecast, by Solution (2020-2032)
10.1.2. Market Revenue and Forecast, by Application (2020-2032)
Chapter 11. Company Profiles
11.1. Eaton Corp., Inc.
11.1.1. Company Overview
11.1.2. Product Offerings
11.1.3. Financial Performance
11.1.4. Recent Initiatives
11.2. Gentex Corp.
11.2.1. Company Overview
11.2.2. Product Offerings
11.2.3. Financial Performance
11.2.4. Recent Initiatives
11.3. Halmaplc
11.3.1. Company Overview
11.3.2. Product Offerings
11.3.3. Financial Performance
11.3.4. Recent Initiatives
11.4. Hochiki Corp.
11.4.1. Company Overview
11.4.2. Product Offerings
11.4.3. Financial Performance
11.4.4. LTE Scientific
11.5. Honeywell International, Inc.
11.5.1. Company Overview
11.5.2. Product Offerings
11.5.3. Financial Performance
11.5.4. Recent Initiatives
11.6. Johnson Controls
11.6.1. Company Overview
11.6.2. Product Offerings
11.6.3. Financial Performance
11.6.4. Recent Initiatives
11.7. Napco Security Technologies, Inc.
11.7.1. Company Overview
11.7.2. Product Offerings
11.7.3. Financial Performance
11.7.4. Recent Initiatives
11.8. Nittan Company, Ltd.
11.8.1. Company Overview
11.8.2. Product Offerings
11.8.3. Financial Performance
11.8.4. Recent Initiatives
11.9. Robert Bosch GmbH
11.9.1. Company Overview
11.9.2. Product Offerings
11.9.3. Financial Performance
11.9.4. Recent Initiatives
11.10. Siemens Building Technologies
11.10.1. Company Overview
11.10.2. Product Offerings
11.10.3. Financial Performance
11.10.4. Recent Initiatives
Chapter 12. Research Methodology
12.1. Primary Research
12.2. Secondary Research
12.3. Assumptions
Chapter 13. Appendix
13.1. About Us
13.2. Glossary of Terms
 Cross-segment Market Size and Analysis for
Mentioned Segments
 Additional Company Profiles (Upto 5 With No Cost)
 Additional Countries (Apart From Mentioned Countries)
 Country/Region-specific Report
 Go To Market Strategy
 Region Specific Market Dynamics
 Region Level Market Share
 Import Export Analysis
 Production Analysis
 Others