AI In Oncology For Analytical Solutions Market Size, Growth, Trends | Report 2023-2032
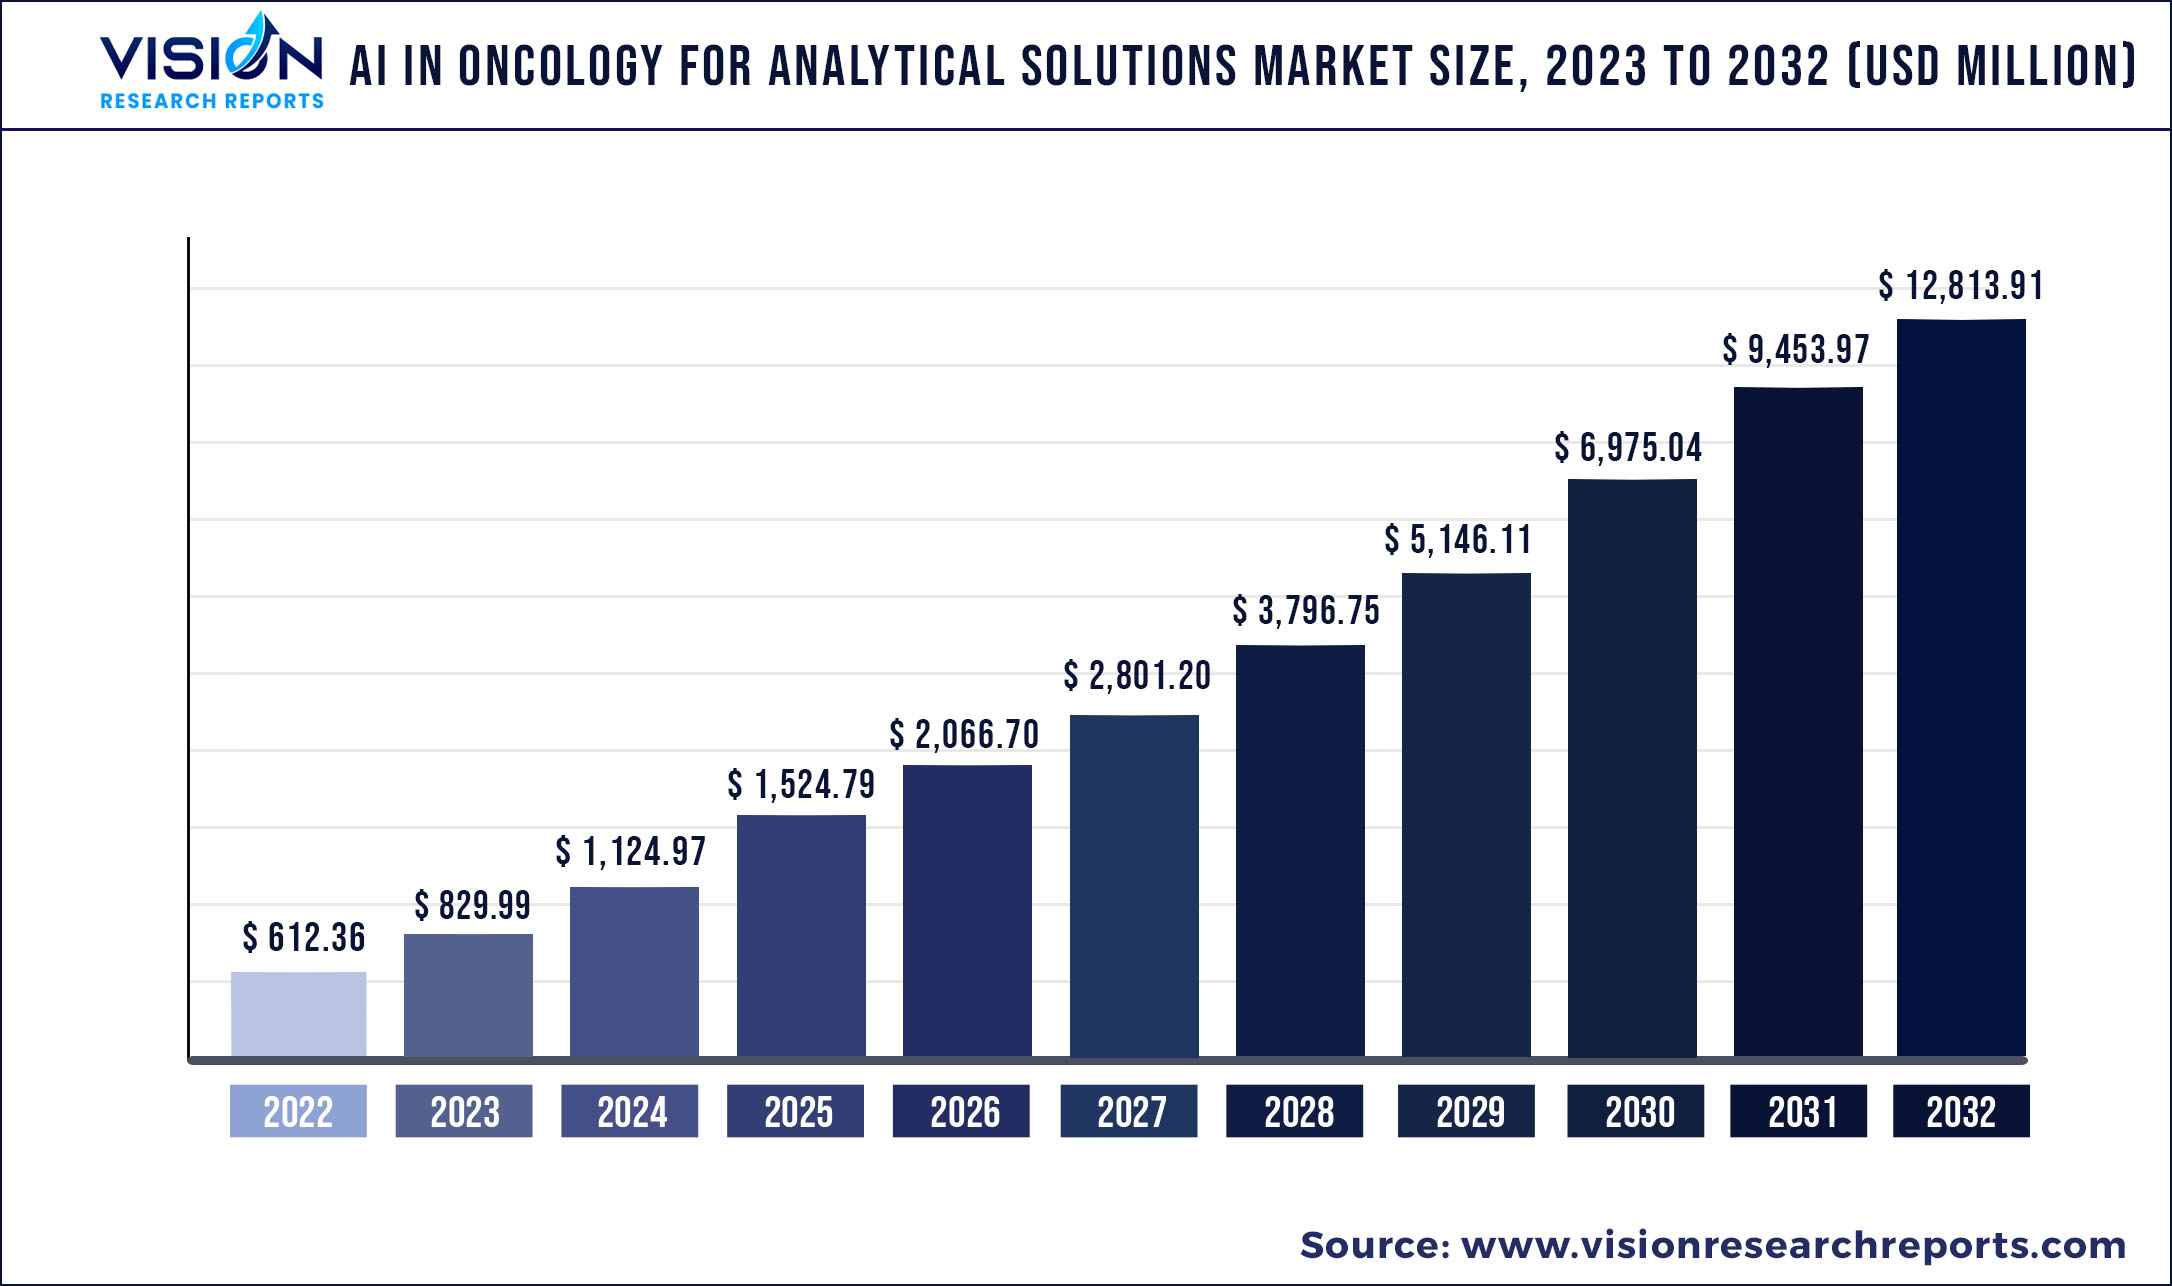
The global AI in oncology for analytical solutions market was surpassed at USD 612.36 million in 2022 and is expected to hit around USD 12,813.91 million by 2032, growing at a CAGR of 35.54% from 2023 to 2032.
Key Pointers
Report Scope of the AI In Oncology For Analytical Solutions Market
| Report Coverage | Details |
| Market Size in 2022 | USD 612.36 million |
| Revenue Forecast by 2032 | USD 12,813.91 million |
| Growth rate from 2023 to 2032 | CAGR of 35.54% |
| Base Year | 2022 |
| Forecast Period | 2023 to 2032 |
| Regions Covered | North America, Europe, Asia Pacific, Latin America, Middle East & Africa |
| Companies Covered | Azra AI; IBM; Siemens Healthineers; Intel; GE Healthcare; NVIDIA; Digital Diagnostics Inc.; Concert.AI; Median Technologies; Path AI |
The market is being driven by the increasing prevalence of cancer. This is due to the fact that there is a rapid growth in the number of cases globally. It is a leading cause of death globally, and in 2020 alone, it resulted in approximately 10 million deaths, which is almost one-sixth of all deaths according to WHO. World health organization further stated one-third of cancer-related deaths can be attributed to factors such as tobacco use, high body mass index, alcohol consumption, inadequate fruit and vegetable consumption, and lack of physical activity. In low- and middle-income countries, cancer-causing infections, such as human papillomavirus (HPV) and hepatitis, account for approximately 30% of all cases. Due to this, the adoption of Artificial Intelligence (AI) for the accurate diagnosis and treatment of this disease is expected to increase, which will contribute to the growth of the market.
The COVID-19 pandemic has had a mixed impact on the market. On one hand, the pandemic has highlighted the importance of technology in healthcare, including artificial intelligence-powered applications. On the other hand, the pandemic has also disrupted the healthcare system, including cancer care, which has affected the adoption and implementation of AI in oncology. One of the major impacts of the pandemic has been a shift toward telemedicine and remote care. This has led to an increase in the use of AI-powered telemedicine tools for disease diagnosis and treatment planning, as well as remote monitoring of patients. This trend is expected to continue even after the pandemic, as it has demonstrated the potential for artificial intelligence in providing more accessible and efficient care. However, the pandemic has also led to a disruption in cancer care, including delays in diagnosis and treatment due to resource constraints and safety concerns. This has affected the adoption of artificial intelligence in oncology, as it relies on a large amount of data and real-world evidence to be effective. Additionally, the economic impact of the pandemic has led to budget cuts in healthcare, which may affect the investment and development of AI in oncology.
Furthermore, individuals with lung cancer have a higher risk of contracting COVID-19. A report published in December 2022, provides information on deaths recorded in Center for Disease Control and Prevention’s National Vital Statistics System between January 1, 2018, and July 2, 2022, where cancer was listed as the underlying or a contributing cause of death. The data analyzed stated, on an average, about 13,000 cancer-related deaths were reported each week, with this disease listed as the underlying cause in 90% of cases in 2018 and 2019, 88% in 2020, and 87% in 2021. Lockdown restrictions during the pandemic posed significant challenges for patients in terms of diagnosis, treatment, and care. However, modern AI and ML technologies have the potential to enhance the diagnosis, care, and treatment of patients, particularly in such challenging circumstances. Artificial intelligence was utilized to address the backlog of cancer imaging during the pandemic, which reduced the workload on healthcare professionals.
AI In Oncology For Analytical Solutions Market Segmentations:
By Component
By Cancer Type
Chapter 1. Introduction
1.1. Research Objective
1.2. Scope of the Study
1.3. Definition
Chapter 2. Research Methodology
2.1. Research Approach
2.2. Data Sources
2.3. Assumptions & Limitations
Chapter 3. Executive Summary
3.1. Market Snapshot
Chapter 4. Market Variables and Scope
4.1. Introduction
4.2. Market Classification and Scope
4.3. Industry Value Chain Analysis
4.3.1. Raw Material Procurement Analysis
4.3.2. Sales and Distribution Channel Analysis
4.3.3. Downstream Buyer Analysis
Chapter 5. COVID 19 Impact on AI In Oncology For Analytical Solutions Market
5.1. COVID-19 Landscape: AI In Oncology For Analytical Solutions Industry Impact
5.2. COVID 19 - Impact Assessment for the Industry
5.3. COVID 19 Impact: Global Major Government Policy
5.4. Market Trends and Opportunities in the COVID-19 Landscape
Chapter 6. Market Dynamics Analysis and Trends
6.1. Market Dynamics
6.1.1. Market Drivers
6.1.2. Market Restraints
6.1.3. Market Opportunities
6.2. Porter’s Five Forces Analysis
6.2.1. Bargaining power of suppliers
6.2.2. Bargaining power of buyers
6.2.3. Threat of substitute
6.2.4. Threat of new entrants
6.2.5. Degree of competition
Chapter 7. Competitive Landscape
7.1.1. Company Market Share/Positioning Analysis
7.1.2. Key Strategies Adopted by Players
7.1.3. Vendor Landscape
7.1.3.1. List of Suppliers
7.1.3.2. List of Buyers
Chapter 8. Global AI In Oncology For Analytical Solutions Market, By Component
8.1. AI In Oncology For Analytical Solutions Market, by Component, 2023-2032
8.1.1. Data Licensing Services
8.1.1.1. Market Revenue and Forecast (2020-2032)
8.1.2. Software Solutions
8.1.2.1. Market Revenue and Forecast (2020-2032)
8.1.3. Analytics and Other Services
8.1.3.1. Market Revenue and Forecast (2020-2032)
Chapter 9. Global AI In Oncology For Analytical Solutions Market, By Cancer Type
9.1. AI In Oncology For Analytical Solutions Market, by Cancer Type, 2023-2032
9.1.1. Breast Cancer
9.1.1.1. Market Revenue and Forecast (2020-2032)
9.1.2. Lung Cancer
9.1.2.1. Market Revenue and Forecast (2020-2032)
9.1.3. Colorectal Cancer
9.1.3.1. Market Revenue and Forecast (2020-2032)
9.1.4. Brain Tumor
9.1.4.1. Market Revenue and Forecast (2020-2032)
9.1.5. Kidney Cancer
9.1.5.1. Market Revenue and Forecast (2020-2032)
9.1.6. Non-Hodgkin Lymphoma
9.1.6.1. Market Revenue and Forecast (2020-2032)
9.1.7. Bladder Cancer
9.1.7.1. Market Revenue and Forecast (2020-2032)
Chapter 10. Global AI In Oncology For Analytical Solutions Market, Regional Estimates and Trend Forecast
10.1. North America
10.1.1. Market Revenue and Forecast, by Component (2020-2032)
10.1.2. Market Revenue and Forecast, by Cancer Type (2020-2032)
10.1.3. U.S.
10.1.3.1. Market Revenue and Forecast, by Component (2020-2032)
10.1.3.2. Market Revenue and Forecast, by Cancer Type (2020-2032)
10.1.4. Rest of North America
10.1.4.1. Market Revenue and Forecast, by Component (2020-2032)
10.1.4.2. Market Revenue and Forecast, by Cancer Type (2020-2032)
10.2. Europe
10.2.1. Market Revenue and Forecast, by Component (2020-2032)
10.2.2. Market Revenue and Forecast, by Cancer Type (2020-2032)
10.2.3. UK
10.2.3.1. Market Revenue and Forecast, by Component (2020-2032)
10.2.3.2. Market Revenue and Forecast, by Cancer Type (2020-2032)
10.2.4. Germany
10.2.4.1. Market Revenue and Forecast, by Component (2020-2032)
10.2.4.2. Market Revenue and Forecast, by Cancer Type (2020-2032)
10.2.5. France
10.2.5.1. Market Revenue and Forecast, by Component (2020-2032)
10.2.5.2. Market Revenue and Forecast, by Cancer Type (2020-2032)
10.2.6. Rest of Europe
10.2.6.1. Market Revenue and Forecast, by Component (2020-2032)
10.2.6.2. Market Revenue and Forecast, by Cancer Type (2020-2032)
10.3. APAC
10.3.1. Market Revenue and Forecast, by Component (2020-2032)
10.3.2. Market Revenue and Forecast, by Cancer Type (2020-2032)
10.3.3. India
10.3.3.1. Market Revenue and Forecast, by Component (2020-2032)
10.3.3.2. Market Revenue and Forecast, by Cancer Type (2020-2032)
10.3.4. China
10.3.4.1. Market Revenue and Forecast, by Component (2020-2032)
10.3.4.2. Market Revenue and Forecast, by Cancer Type (2020-2032)
10.3.5. Japan
10.3.5.1. Market Revenue and Forecast, by Component (2020-2032)
10.3.5.2. Market Revenue and Forecast, by Cancer Type (2020-2032)
10.3.6. Rest of APAC
10.3.6.1. Market Revenue and Forecast, by Component (2020-2032)
10.3.6.2. Market Revenue and Forecast, by Cancer Type (2020-2032)
10.4. MEA
10.4.1. Market Revenue and Forecast, by Component (2020-2032)
10.4.2. Market Revenue and Forecast, by Cancer Type (2020-2032)
10.4.3. GCC
10.4.3.1. Market Revenue and Forecast, by Component (2020-2032)
10.4.3.2. Market Revenue and Forecast, by Cancer Type (2020-2032)
10.4.4. North Africa
10.4.4.1. Market Revenue and Forecast, by Component (2020-2032)
10.4.4.2. Market Revenue and Forecast, by Cancer Type (2020-2032)
10.4.5. South Africa
10.4.5.1. Market Revenue and Forecast, by Component (2020-2032)
10.4.5.2. Market Revenue and Forecast, by Cancer Type (2020-2032)
10.4.6. Rest of MEA
10.4.6.1. Market Revenue and Forecast, by Component (2020-2032)
10.4.6.2. Market Revenue and Forecast, by Cancer Type (2020-2032)
10.5. Latin America
10.5.1. Market Revenue and Forecast, by Component (2020-2032)
10.5.2. Market Revenue and Forecast, by Cancer Type (2020-2032)
10.5.3. Brazil
10.5.3.1. Market Revenue and Forecast, by Component (2020-2032)
10.5.3.2. Market Revenue and Forecast, by Cancer Type (2020-2032)
10.5.4. Rest of LATAM
10.5.4.1. Market Revenue and Forecast, by Component (2020-2032)
10.5.4.2. Market Revenue and Forecast, by Cancer Type (2020-2032)
Chapter 11. Company Profiles
11.1. Azra AI
11.1.1. Company Overview
11.1.2. Product Offerings
11.1.3. Financial Performance
11.1.4. Recent Initiatives
11.2. IBM
11.2.1. Company Overview
11.2.2. Product Offerings
11.2.3. Financial Performance
11.2.4. Recent Initiatives
11.3. Siemens Healthineers
11.3.1. Company Overview
11.3.2. Product Offerings
11.3.3. Financial Performance
11.3.4. Recent Initiatives
11.4. Intel
11.4.1. Company Overview
11.4.2. Product Offerings
11.4.3. Financial Performance
11.4.4. LTE Scientific
11.5. GE Healthcare
11.5.1. Company Overview
11.5.2. Product Offerings
11.5.3. Financial Performance
11.5.4. Recent Initiatives
11.6. NVIDIA
11.6.1. Company Overview
11.6.2. Product Offerings
11.6.3. Financial Performance
11.6.4. Recent Initiatives
11.7. Digital Diagnostics Inc.
11.7.1. Company Overview
11.7.2. Product Offerings
11.7.3. Financial Performance
11.7.4. Recent Initiatives
11.8. Concert.AI
11.8.1. Company Overview
11.8.2. Product Offerings
11.8.3. Financial Performance
11.8.4. Recent Initiatives
11.9. Median Technologies
11.9.1. Company Overview
11.9.2. Product Offerings
11.9.3. Financial Performance
11.9.4. Recent Initiatives
11.10. Path AI
11.10.1. Company Overview
11.10.2. Product Offerings
11.10.3. Financial Performance
11.10.4. Recent Initiatives
Chapter 12. Research Methodology
12.1. Primary Research
12.2. Secondary Research
12.3. Assumptions
Chapter 13. Appendix
13.1. About Us
13.2. Glossary of Terms
 Cross-segment Market Size and Analysis for
Mentioned Segments
Additional Company Profiles (Upto 5 With No Cost)
Additional Countries (Apart From Mentioned Countries)
Country/Region-specific Report
Go To Market Strategy
Region Specific Market DynamicsRegion Level Market Share Import Export AnalysisProduction AnalysisOthers
Cross-segment Market Size and Analysis for
Mentioned Segments
Additional Company Profiles (Upto 5 With No Cost)
Additional Countries (Apart From Mentioned Countries)
Country/Region-specific Report
Go To Market Strategy
Region Specific Market DynamicsRegion Level Market Share Import Export AnalysisProduction AnalysisOthers