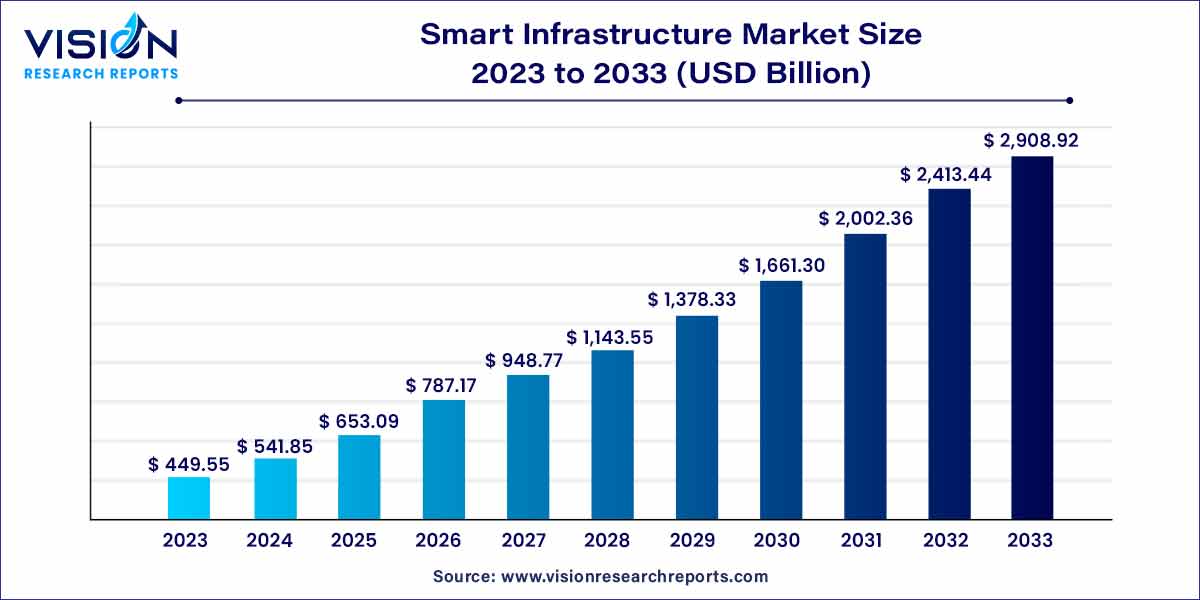
The global smart infrastructure market size was estimated at around USD 449.55 billion in 2023 and it is projected to hit around USD 2908.92 billion by 2033, growing at a CAGR of 20.53% from 2024 to 2033.

The smart infrastructure market is experiencing unprecedented growth as societies globally embrace digital transformation. This paradigm shift towards intelligent, connected systems is reshaping traditional infrastructure, enhancing efficiency, sustainability, and overall quality of life. This overview delves into the key facets of the smart infrastructure market, exploring its current landscape, driving factors, and potential future trends.
The growth of the smart infrastructure market is propelled by various factors contributing to its dynamic expansion. Central to this progression is the relentless pursuit of efficiency enhancement, as smart infrastructure integrates real-time data and analytics, facilitating predictive maintenance and optimized operations. Sustainability is another pivotal driver, with smart technologies actively promoting eco-friendly practices through energy conservation, waste reduction, and the optimization of transportation systems. Rapid urbanization further fuels this growth, as smart solutions address challenges associated with burgeoning populations, offering innovative approaches to city planning and management. Continuous technological advancements, particularly in the Internet of Things (IoT), Artificial Intelligence (AI), and connectivity solutions, underpin the market's evolution, creating a fertile ground for novel applications and services. As these growth factors converge, the smart infrastructure market is poised to redefine how societies interact with and harness the potential of their infrastructural systems.
| Report Coverage | Details |
| Growth Rate from 2024 to 2033 | CAGR of 20.53% |
| Market Revenue by 2033 | USD 2908.92 billion |
| Revenue Share of North America in 2023 | 31% |
| Base Year | 2023 |
| Forecast Period | 2024 to 2033 |
| Market Analysis (Terms Used) | Value (US$ Million/Billion) or (Volume/Units) |
In 2022, products segment held the largest revenue share of 69%. This substantial segment share is a result of the escalating adoption of smart infrastructure hardware and software. Notable examples include smart grid solutions, Building Automation Systems (BAS), and Internet of Things (IoT)-based environmental monitoring systems. These technologies are deployed to enhance operational efficiency and mitigate human errors. Foreseen to maintain its dominance through 2030, the products segment is expected to exhibit robust functionality, propelled by ongoing technological advancements in smart infrastructure solutions development.
On the other hand, service offerings are poised to experience the highest CAGR from 2024 to 2033 in the smart infrastructure market. This anticipated growth is attributed to a shift in organizational focus towards leveraging smart infrastructure services to optimize budgets. Market players are actively providing consulting, support & maintenance, and designing services to assist end-users in digitalizing their operations and maximizing business profitability.
In 2023, the smart transportation system claimed the largest revenue share. Ongoing advancements in computing, communication sensors, and network speed have facilitated a comprehensive overhaul of transportation infrastructure, vehicular operations, and traffic management. The integration of sensing technologies and telecommunications has significantly enhanced the safety and security features of transportation systems. This segment is poised for numerous opportunities during the forecast period, driven by favorable policies, increased awareness of road safety, and the continuous growth in the number of vehicles.
Conversely, smart waste management is anticipated to register the fastest CAGR in the forecast period. This substantial growth is attributed to the increased adoption of smart bin technology, the implementation of Blockchain for comprehensive waste tracking from generation to disposal, and the development of automated sorting systems. Major stakeholders, including local governments, technology solution providers, distributors, and system integrators, play crucial roles in implementing city-level waste management projects. The development of various mobile apps for monitoring bin fill levels adds to user convenience, contributing to the swift growth of this segment.
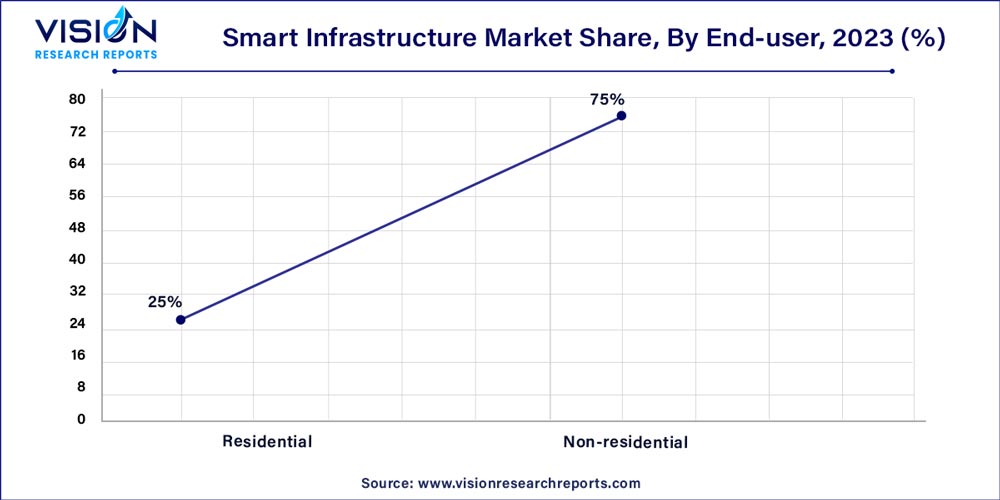
In 2023, non-residential segment held the largest revenue share of 75%, primarily driven by the escalating adoption of smart infrastructure solutions within commercial and industrial entities. These organizations are leveraging smart technologies to digitize their operations, thereby enhancing overall consumer experiences. The core of smart infrastructure solutions lies in automation systems that streamline operations and optimize resource utilization. Additionally, businesses are incorporating these solutions to fortify the digital security and safety of their sensitive data.

Conversely, the residential end-user segment is poised for the highest growth rate during the forecast period. This surge is fueled by the increasing demand for managing HVAC systems, implementing smart home lighting, deploying smart meters, and employing secure smart door lock systems to oversee and regulate a building's electrical and mechanical systems. Furthermore, this segment stands to benefit from the growing awareness of smart grids, the expansion of the consumer electronics sector, rising personal incomes in developing economies, and advancements in power line communication.
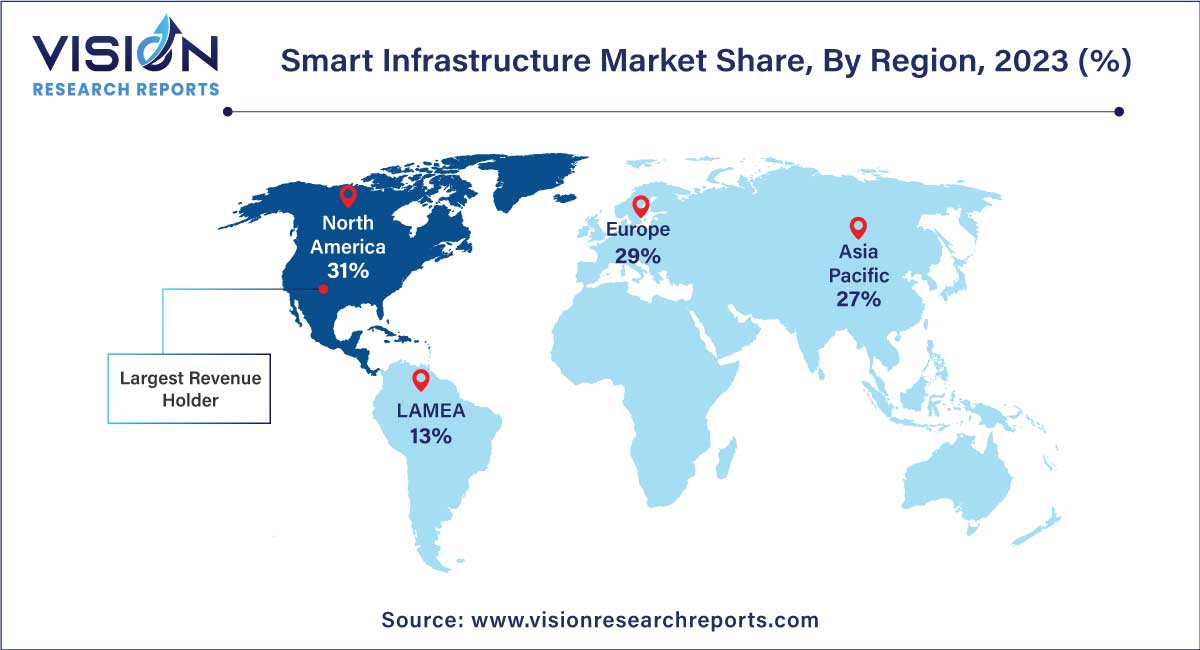
North America dominated the market with the largest market share of 31% in 2023. This leading position is attributed to the presence of well-established market players, including Cisco Systems Inc., Honeywell International Inc., Johnson Controls, and International Business Machines Corporation. Additionally, favorable government policies supporting digitalization further contributed to this high market share. In the United States, a notable trend in non-residential sectors involves the transformation of traditional offices into smart offices. These initiatives by end-user companies are expected to fuel the adoption of smart infrastructure solutions in the country throughout the forecast period.

Meanwhile, Asia Pacific is poised for significant growth in the smart infrastructure industry. This growth is driven by factors such as rapid urbanization, a consumer shift towards IoT-based remote management services, and an increasing rate of internet penetration. China, in particular, is experiencing substantial market growth due to supportive government initiatives promoting smart cities and a growing concern about energy consumption in buildings. Additionally, industries across the region are focusing on automation to enhance business operations and reduce overhead costs.
By Offering
By Type
By End-user
By Region
Chapter 1. Introduction
1.1. Research Objective
1.2. Scope of the Study
1.3. Definition
Chapter 2. Research Methodology
2.1. Research Approach
2.2. Data Sources
2.3. Assumptions & Limitations
Chapter 3. Executive Summary
3.1. Market Snapshot
Chapter 4. Market Variables and Scope
4.1. Introduction
4.2. Market Classification and Scope
4.3. Industry Value Chain Analysis
4.3.1. Raw Material Procurement Analysis
4.3.2. Sales and Distribution Offering Analysis
4.3.3. Downstream Buyer Analysis
Chapter 5. COVID 19 Impact on Smart Infrastructure Market
5.1. COVID-19 Landscape: Smart Infrastructure Industry Impact
5.2. COVID 19 - Impact Assessment for the Industry
5.3. COVID 19 Impact: Global Major Government Policy
5.4. Market Trends and Opportunities in the COVID-19 Landscape
Chapter 6. Market Dynamics Analysis and Trends
6.1. Market Dynamics
6.1.1. Market Drivers
6.1.2. Market Restraints
6.1.3. Market Opportunities
6.2. Porter’s Five Forces Analysis
6.2.1. Bargaining power of suppliers
6.2.2. Bargaining power of buyers
6.2.3. Threat of substitute
6.2.4. Threat of new entrants
6.2.5. Degree of competition
Chapter 7. Competitive Landscape
7.1.1. Company Market Share/Positioning Analysis
7.1.2. Key Strategies Adopted by Players
7.1.3. Vendor Landscape
7.1.3.1. List of Suppliers
7.1.3.2. List of Buyers
Chapter 8. Global Smart Infrastructure Market, By Offering
8.1. Smart Infrastructure Market, by Offering, 2024-2033
8.1.1 Products
8.1.1.1. Market Revenue and Forecast (2021-2033)
8.1.2. Services
8.1.2.1. Market Revenue and Forecast (2021-2033)
Chapter 9. Global Smart Infrastructure Market, By Type
9.1. Smart Infrastructure Market, by Type, 2024-2033
9.1.1. Smart Transportation System
9.1.1.1. Market Revenue and Forecast (2021-2033)
9.1.2. Smart Energy Management System
9.1.2.1. Market Revenue and Forecast (2021-2033)
9.1.3. Smart Safety & Security Systems
9.1.3.1. Market Revenue and Forecast (2021-2033)
9.1.4. Smart Waste Management Solutions
9.1.4.1. Market Revenue and Forecast (2021-2033)
9.1.5. Others
9.1.5.1. Market Revenue and Forecast (2021-2033)
Chapter 10. Global Smart Infrastructure Market, By End-user
10.1. Smart Infrastructure Market, by End-user, 2024-2033
10.1.1. Residential
10.1.1.1. Market Revenue and Forecast (2021-2033)
10.1.2. Non-residential
10.1.2.1. Market Revenue and Forecast (2021-2033)
Chapter 11. Global Smart Infrastructure Market, Regional Estimates and Trend Forecast
11.1. North America
11.1.1. Market Revenue and Forecast, by Offering (2021-2033)
11.1.2. Market Revenue and Forecast, by Type (2021-2033)
11.1.3. Market Revenue and Forecast, by End-user (2021-2033)
11.1.4. U.S.
11.1.4.1. Market Revenue and Forecast, by Offering (2021-2033)
11.1.4.2. Market Revenue and Forecast, by Type (2021-2033)
11.1.4.3. Market Revenue and Forecast, by End-user (2021-2033)
11.1.5. Rest of North America
11.1.5.1. Market Revenue and Forecast, by Offering (2021-2033)
11.1.5.2. Market Revenue and Forecast, by Type (2021-2033)
11.1.5.3. Market Revenue and Forecast, by End-user (2021-2033)
11.2. Europe
11.2.1. Market Revenue and Forecast, by Offering (2021-2033)
11.2.2. Market Revenue and Forecast, by Type (2021-2033)
11.2.3. Market Revenue and Forecast, by End-user (2021-2033)
11.2.4. UK
11.2.4.1. Market Revenue and Forecast, by Offering (2021-2033)
11.2.4.2. Market Revenue and Forecast, by Type (2021-2033)
11.2.4.3. Market Revenue and Forecast, by End-user (2021-2033)
11.2.5. Germany
11.2.5.1. Market Revenue and Forecast, by Offering (2021-2033)
11.2.5.2. Market Revenue and Forecast, by Type (2021-2033)
11.2.5.3. Market Revenue and Forecast, by End-user (2021-2033)
11.2.6. France
11.2.6.1. Market Revenue and Forecast, by Offering (2021-2033)
11.2.6.2. Market Revenue and Forecast, by Type (2021-2033)
11.2.6.3. Market Revenue and Forecast, by End-user (2021-2033)
11.2.7. Rest of Europe
11.2.7.1. Market Revenue and Forecast, by Offering (2021-2033)
11.2.7.2. Market Revenue and Forecast, by Type (2021-2033)
11.2.7.3. Market Revenue and Forecast, by End-user (2021-2033)
11.3. APAC
11.3.1. Market Revenue and Forecast, by Offering (2021-2033)
11.3.2. Market Revenue and Forecast, by Type (2021-2033)
11.3.3. Market Revenue and Forecast, by End-user (2021-2033)
11.3.4. India
11.3.4.1. Market Revenue and Forecast, by Offering (2021-2033)
11.3.4.2. Market Revenue and Forecast, by Type (2021-2033)
11.3.4.3. Market Revenue and Forecast, by End-user (2021-2033)
11.3.5. China
11.3.5.1. Market Revenue and Forecast, by Offering (2021-2033)
11.3.5.2. Market Revenue and Forecast, by Type (2021-2033)
11.3.5.3. Market Revenue and Forecast, by End-user (2021-2033)
11.3.6. Japan
11.3.6.1. Market Revenue and Forecast, by Offering (2021-2033)
11.3.6.2. Market Revenue and Forecast, by Type (2021-2033)
11.3.6.3. Market Revenue and Forecast, by End-user (2021-2033)
11.3.7. Rest of APAC
11.3.7.1. Market Revenue and Forecast, by Offering (2021-2033)
11.3.7.2. Market Revenue and Forecast, by Type (2021-2033)
11.3.7.3. Market Revenue and Forecast, by End-user (2021-2033)
11.4. MEA
11.4.1. Market Revenue and Forecast, by Offering (2021-2033)
11.4.2. Market Revenue and Forecast, by Type (2021-2033)
11.4.3. Market Revenue and Forecast, by End-user (2021-2033)
11.4.4. GCC
11.4.4.1. Market Revenue and Forecast, by Offering (2021-2033)
11.4.4.2. Market Revenue and Forecast, by Type (2021-2033)
11.4.4.3. Market Revenue and Forecast, by End-user (2021-2033)
11.4.5. North Africa
11.4.5.1. Market Revenue and Forecast, by Offering (2021-2033)
11.4.5.2. Market Revenue and Forecast, by Type (2021-2033)
11.4.5.3. Market Revenue and Forecast, by End-user (2021-2033)
11.4.6. South Africa
11.4.6.1. Market Revenue and Forecast, by Offering (2021-2033)
11.4.6.2. Market Revenue and Forecast, by Type (2021-2033)
11.4.6.3. Market Revenue and Forecast, by End-user (2021-2033)
11.4.7. Rest of MEA
11.4.7.1. Market Revenue and Forecast, by Offering (2021-2033)
11.4.7.2. Market Revenue and Forecast, by Type (2021-2033)
11.4.7.3. Market Revenue and Forecast, by End-user (2021-2033)
11.5. Latin America
11.5.1. Market Revenue and Forecast, by Offering (2021-2033)
11.5.2. Market Revenue and Forecast, by Type (2021-2033)
11.5.3. Market Revenue and Forecast, by End-user (2021-2033)
11.5.4. Brazil
11.5.4.1. Market Revenue and Forecast, by Offering (2021-2033)
11.5.4.2. Market Revenue and Forecast, by Type (2021-2033)
11.5.4.3. Market Revenue and Forecast, by End-user (2021-2033)
11.5.5. Rest of LATAM
11.5.5.1. Market Revenue and Forecast, by Offering (2021-2033)
11.5.5.2. Market Revenue and Forecast, by Type (2021-2033)
11.5.5.3. Market Revenue and Forecast, by End-user (2021-2033)
Chapter 12. Company Profiles
12.1. ABB.
12.1.1. Company Overview
12.1.2. Product Offerings
12.1.3. Financial Performance
12.1.4. Recent Initiatives
12.2. Aclara Technologies LLC (Hubbell Incorporated).
12.2.1. Company Overview
12.2.2. Product Offerings
12.2.3. Financial Performance
12.2.4. Recent Initiatives
12.3. Broadcom, Inc. (VMware).
12.3.1. Company Overview
12.3.2. Product Offerings
12.3.3. Financial Performance
12.3.4. Recent Initiatives
12.4. Cisco Systems, Inc.
12.4.1. Company Overview
12.4.2. Product Offerings
12.4.3. Financial Performance
12.4.4. Recent Initiatives
12.5. Dynamic Ratings.
12.5.1. Company Overview
12.5.2. Product Offerings
12.5.3. Financial Performance
12.5.4. Recent Initiatives
12.6. Honeywell International Inc.
12.6.1. Company Overview
12.6.2. Product Offerings
12.6.3. Financial Performance
12.6.4. Recent Initiatives
12.7. Hewlett Packard Enterprise Development LP.
12.7.1. Company Overview
12.7.2. Product Offerings
12.7.3. Financial Performance
12.7.4. Recent Initiatives
12.8. Huawei Technologies Co., Ltd.
12.8.1. Company Overview
12.8.2. Product Offerings
12.8.3. Financial Performance
12.8.4. Recent Initiatives
12.9. International Business Machines Corporation.
12.9.1. Company Overview
12.9.2. Product Offerings
12.9.3. Financial Performance
12.9.4. Recent Initiatives
12.10. L&T Technology Services Limited
12.10.1. Company Overview
12.10.2. Product Offerings
12.10.3. Financial Performance
12.10.4. Recent Initiatives
Chapter 13. Research Methodology
13.1. Primary Research
13.2. Secondary Research
13.3. Assumptions
Chapter 14. Appendix
14.1. About Us
14.2. Glossary of Terms
 Cross-segment Market Size and Analysis for
Mentioned Segments
 Additional Company Profiles (Upto 5 With No Cost)
 Additional Countries (Apart From Mentioned Countries)
 Country/Region-specific Report
 Go To Market Strategy
 Region Specific Market Dynamics
 Region Level Market Share
 Import Export Analysis
 Production Analysis
 Others