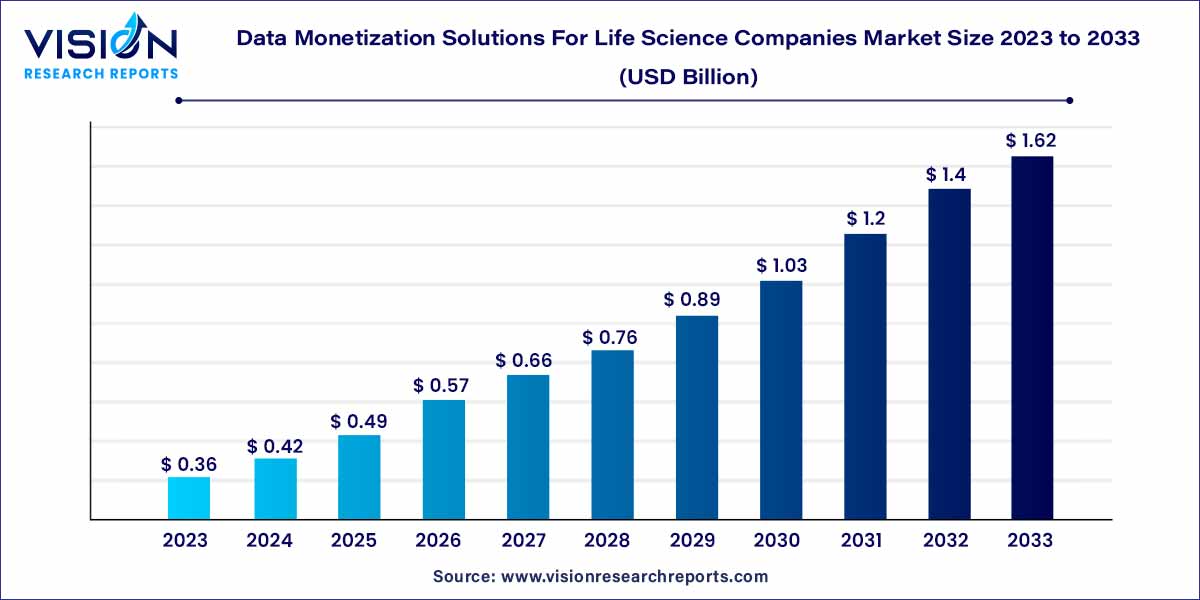
The global data monetization solutions for life science companies market size was valued at USD 0.36 billion in 2023 and it is predicted to surpass around USD 1.62 billion by 2033 with a CAGR of 16.25% from 2024 to 2033.

In the ever-evolving landscape of the life science industry, data has emerged as a pivotal asset, offering companies vast opportunities for innovation and revenue generation. The concept of data monetization, specifically designed for life science companies, has gained substantial prominence. This overview provides a comprehensive insight into the nuances of data monetization solutions, illuminating the key trends, challenges, and opportunities within the life science sector.
The growth of data monetization solutions within the life science sector is underpinned by several key factors. Firstly, the industry's increasing recognition of data as a valuable asset drives companies to invest in advanced analytics, artificial intelligence, and machine learning. These technologies enable the extraction of meaningful insights from complex datasets, fostering innovation in drug discovery, clinical trials, and patient care. Secondly, the rise of personalized medicine, facilitated by data analysis, enhances treatment efficacy and patient outcomes, creating substantial market opportunities. Additionally, the integration of blockchain technology ensures data integrity and security, addressing concerns related to privacy and compliance. Moreover, collaborative partnerships between life science companies and tech firms stimulate innovation, leading to the development of novel data-driven solutions. Lastly, the continuous evolution of data-driven methodologies and a focus on ethical data usage propel the market forward, encouraging companies to explore innovative ways to leverage their data assets responsibly. These growth factors collectively contribute to the expanding landscape of data monetization solutions tailored for life science companies.
| Report Coverage | Details |
| Growth Rate from 2024 to 2033 | CAGR of 16.25% |
| Market Revenue by 2033 | USD 1.62 billion |
| Revenue Share of North America in 2023 | 43% |
| CAGR of Asia Pacific from 2024 to 2033 | 17.14% |
| Base Year | 2023 |
| Forecast Period | 2024 to 2033 |
| Market Analysis (Terms Used) | Value (US$ Million/Billion) or (Volume/Units)Companies Covered |
The software segment held the largest revenue share of 59% in 2023. This segment is expected to continue its dominance with an anticipated fastest CAGR of 16.3% over the forecast period. Software solutions tailored for this sector encompass a spectrum of advanced technologies, ranging from data analytics platforms to artificial intelligence-driven algorithms. These software offerings enable companies to process vast datasets, extracting actionable insights that drive critical decision-making processes. Whether it’s optimizing clinical trials, enhancing patient care, or innovating new treatments, these software solutions serve as the backbone of data-driven initiatives, providing the necessary tools to transform raw data into strategic assets.
Software, services form an integral component of the data monetization ecosystem. These services, offered by specialized technology firms, encompass a myriad of functions. Data integration services play a vital role in harmonizing diverse datasets from disparate sources, ensuring seamless data flow and integrity. Data analysis services utilize advanced statistical methods and machine learning algorithms to identify patterns and trends within the data, facilitating evidence-based decision-making. Furthermore, consulting and advisory services provide valuable expertise, guiding life science companies in formulating data monetization strategies aligned with their business objectives. These services are not just transactional but are strategic partnerships, wherein experts collaborate closely with companies, unlocking the full potential of their data assets.
The large enterprises segment dominated the market in 2023 with the largest revenue share of 56%. Large Enterprises in the life science sector view data monetization as a strategic imperative. With substantial datasets generated from extensive research, clinical trials, and patient interactions, large enterprises possess a wealth of information. Data monetization allows these enterprises to extract maximum value from their data, fueling innovation and driving competitive advantage. Large enterprises deploy sophisticated data analytics platforms, artificial intelligence, and machine learning algorithms to delve deep into their datasets. These technologies facilitate predictive modeling, enabling large enterprises to anticipate market trends, optimize supply chains, and accelerate drug discovery. Furthermore, personalized medicine initiatives, heavily reliant on vast datasets, are significantly enhanced through data monetization in large enterprises. Collaborative ventures, both within the organization and with external partners, are streamlined through efficient data integration, leading to groundbreaking advancements in treatments and therapies.
The small & medium enterprise segment is anticipated to grow at the fastest CAGR of 16.47% over the forecast period. For Small and Medium Enterprises (SMEs), the adoption of data monetization solutions signifies a pathway to level the competitive playing field. These enterprises often possess valuable data assets but might lack the resources of their larger counterparts. Data monetization provides SMEs with an opportunity to leverage their existing data reservoirs, gaining actionable insights to refine their operations, enhance research processes, and improve customer engagement. Advanced analytics and cloud-based solutions enable SMEs to optimize their limited resources, enabling efficient data processing and analysis. Moreover, data monetization empowers SMEs to make informed decisions, fostering agility and adaptability in the rapidly changing life science landscape.
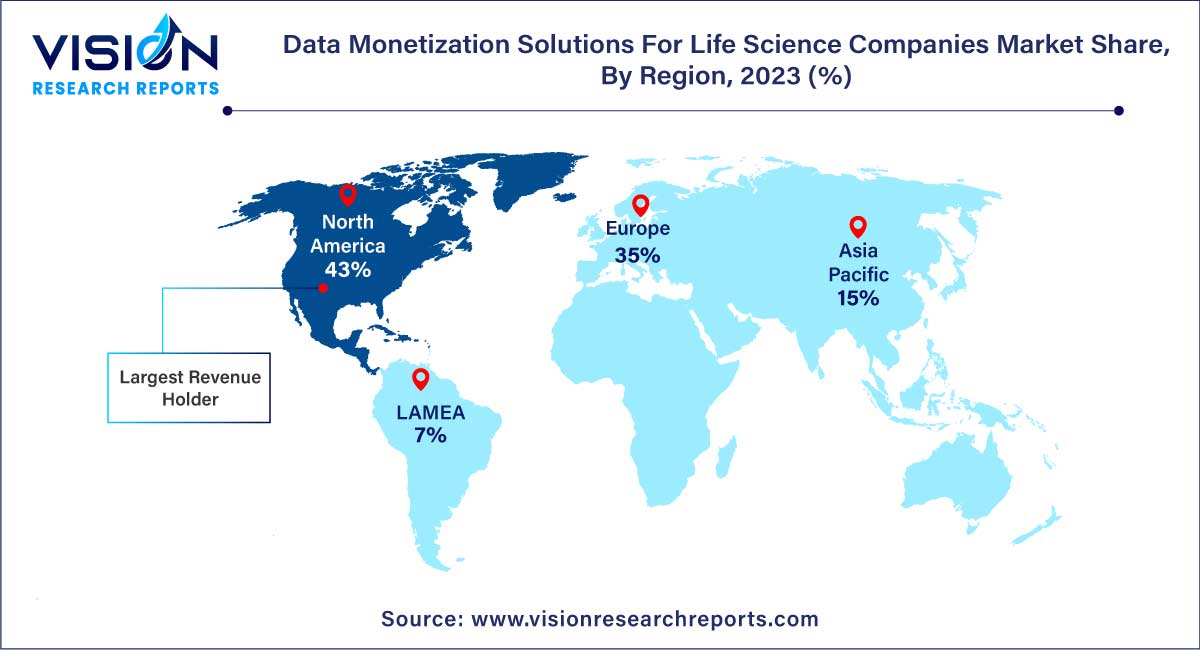
North America dominated the market in 2023 with the largest revenue share of 43%. In North America, particularly in the United States and Canada, the market is characterized by robust investments in research and development. The presence of numerous pharmaceutical and biotechnology companies drives the demand for advanced data analytics and artificial intelligence solutions. Additionally, favorable government initiatives and regulatory frameworks promote the adoption of data monetization strategies, making North America a thriving hub for innovative data-driven initiatives in the life science sector.

Asia Pacific is expected to grow at the notable CAGR of 17.14% over the forecast period. Asia-Pacific emerges as a burgeoning market, with countries such as China, Japan, and India at the forefront. Rapid technological advancements, coupled with a growing emphasis on healthcare infrastructure, drive the adoption of data monetization solutions in this region. Life science companies in Asia-Pacific leverage data analytics to gain competitive advantages, optimize supply chains, and develop cost-effective therapies. Moreover, a rising focus on precision medicine and genomics research amplifies the demand for sophisticated data-driven approaches, positioning Asia-Pacific as a key player in the global data monetization landscape.
By Type
By Enterprise Size
By Region
Chapter 1. Introduction
1.1. Research Objective
1.2. Scope of the Study
1.3. Definition
Chapter 2. Research Methodology
2.1. Research Approach
2.2. Data Sources
2.3. Assumptions & Limitations
Chapter 3. Executive Summary
3.1. Market Snapshot
Chapter 4. Market Variables and Scope
4.1. Introduction
4.2. Market Classification and Scope
4.3. Industry Value Chain Analysis
4.3.1. Raw Material Procurement Analysis
4.3.2. Sales and Distribution Channel Analysis
4.3.3. Downstream Buyer Analysis
Chapter 5. COVID 19 Impact on Data Monetization Solutions For Life Science Companies Market
5.1. COVID-19 Landscape: Data Monetization Solutions For Life Science Companies Industry Impact
5.2. COVID 19 - Impact Assessment for the Industry
5.3. COVID 19 Impact: Global Major Government Policy
5.4. Market Trends and Opportunities in the COVID-19 Landscape
Chapter 6. Market Dynamics Analysis and Trends
6.1. Market Dynamics
6.1.1. Market Drivers
6.1.2. Market Restraints
6.1.3. Market Opportunities
6.2. Porter’s Five Forces Analysis
6.2.1. Bargaining power of suppliers
6.2.2. Bargaining power of buyers
6.2.3. Threat of substitute
6.2.4. Threat of new entrants
6.2.5. Degree of competition
Chapter 7. Competitive Landscape
7.1.1. Company Market Share/Positioning Analysis
7.1.2. Key Strategies Adopted by Players
7.1.3. Vendor Landscape
7.1.3.1. List of Suppliers
7.1.3.2. List of Buyers
Chapter 8. Global Data Monetization Solutions For Life Science Companies Market, By Type
8.1. Data Monetization Solutions For Life Science Companies Market, by Type, 2024-2033
8.1.1. Software
8.1.1.1. Market Revenue and Forecast (2021-2033)
8.1.2. Services
8.1.2.1. Market Revenue and Forecast (2021-2033)
Chapter 9. Global Data Monetization Solutions For Life Science Companies Market, By Enterprise Size
9.1. Data Monetization Solutions For Life Science Companies Market, by Enterprise Size, 2024-2033
9.1.1. Small & Medium Enterprises
9.1.1.1. Market Revenue and Forecast (2021-2033)
9.1.2. Large Enterprises
9.1.2.1. Market Revenue and Forecast (2021-2033)
Chapter 10. Global Data Monetization Solutions For Life Science Companies Market, Regional Estimates and Trend Forecast
10.1. North America
10.1.1. Market Revenue and Forecast, by Type (2021-2033)
10.1.2. Market Revenue and Forecast, by Enterprise Size (2021-2033)
10.1.3. U.S.
10.1.3.1. Market Revenue and Forecast, by Type (2021-2033)
10.1.3.2. Market Revenue and Forecast, by Enterprise Size (2021-2033)
10.1.4. Rest of North America
10.1.4.1. Market Revenue and Forecast, by Type (2021-2033)
10.1.4.2. Market Revenue and Forecast, by Enterprise Size (2021-2033)
10.2. Europe
10.2.1. Market Revenue and Forecast, by Type (2021-2033)
10.2.2. Market Revenue and Forecast, by Enterprise Size (2021-2033)
10.2.3. UK
10.2.3.1. Market Revenue and Forecast, by Type (2021-2033)
10.2.3.2. Market Revenue and Forecast, by Enterprise Size (2021-2033)
10.2.4. Germany
10.2.4.1. Market Revenue and Forecast, by Type (2021-2033)
10.2.4.2. Market Revenue and Forecast, by Enterprise Size (2021-2033)
10.2.5. France
10.2.5.1. Market Revenue and Forecast, by Type (2021-2033)
10.2.5.2. Market Revenue and Forecast, by Enterprise Size (2021-2033)
10.2.6. Rest of Europe
10.2.6.1. Market Revenue and Forecast, by Type (2021-2033)
10.2.6.2. Market Revenue and Forecast, by Enterprise Size (2021-2033)
10.3. APAC
10.3.1. Market Revenue and Forecast, by Type (2021-2033)
10.3.2. Market Revenue and Forecast, by Enterprise Size (2021-2033)
10.3.3. India
10.3.3.1. Market Revenue and Forecast, by Type (2021-2033)
10.3.3.2. Market Revenue and Forecast, by Enterprise Size (2021-2033)
10.3.4. China
10.3.4.1. Market Revenue and Forecast, by Type (2021-2033)
10.3.4.2. Market Revenue and Forecast, by Enterprise Size (2021-2033)
10.3.5. Japan
10.3.5.1. Market Revenue and Forecast, by Type (2021-2033)
10.3.5.2. Market Revenue and Forecast, by Enterprise Size (2021-2033)
10.3.6. Rest of APAC
10.3.6.1. Market Revenue and Forecast, by Type (2021-2033)
10.3.6.2. Market Revenue and Forecast, by Enterprise Size (2021-2033)
10.4. MEA
10.4.1. Market Revenue and Forecast, by Type (2021-2033)
10.4.2. Market Revenue and Forecast, by Enterprise Size (2021-2033)
10.4.3. GCC
10.4.3.1. Market Revenue and Forecast, by Type (2021-2033)
10.4.3.2. Market Revenue and Forecast, by Enterprise Size (2021-2033)
10.4.4. North Africa
10.4.4.1. Market Revenue and Forecast, by Type (2021-2033)
10.4.4.2. Market Revenue and Forecast, by Enterprise Size (2021-2033)
10.4.5. South Africa
10.4.5.1. Market Revenue and Forecast, by Type (2021-2033)
10.4.5.2. Market Revenue and Forecast, by Enterprise Size (2021-2033)
10.4.6. Rest of MEA
10.4.6.1. Market Revenue and Forecast, by Type (2021-2033)
10.4.6.2. Market Revenue and Forecast, by Enterprise Size (2021-2033)
10.5. Latin America
10.5.1. Market Revenue and Forecast, by Type (2021-2033)
10.5.2. Market Revenue and Forecast, by Enterprise Size (2021-2033)
10.5.3. Brazil
10.5.3.1. Market Revenue and Forecast, by Type (2021-2033)
10.5.3.2. Market Revenue and Forecast, by Enterprise Size (2021-2033)
10.5.4. Rest of LATAM
10.5.4.1. Market Revenue and Forecast, by Type (2021-2033)
10.5.4.2. Market Revenue and Forecast, by Enterprise Size (2021-2033)
Chapter 11. Company Profiles
11.1. Cisco Systems
11.1.1. Company Overview
11.1.2. Product Offerings
11.1.3. Financial Performance
11.1.4. Recent Initiatives
11.2. Siemens
11.2.1. Company Overview
11.2.2. Product Offerings
11.2.3. Financial Performance
11.2.4. Recent Initiatives
11.3. Particle Health, Inc.
11.3.1. Company Overview
11.3.2. Product Offerings
11.3.3. Financial Performance
11.3.4. Recent Initiatives
11.4. Snowflake Inc.
11.4.1. Company Overview
11.4.2. Product Offerings
11.4.3. Financial Performance
11.4.4. LTE Scientific
11.5. Oracle
11.5.1. Company Overview
11.5.2. Product Offerings
11.5.3. Financial Performance
11.5.4. Recent Initiatives
11.6. Microsoft
11.6.1. Company Overview
11.6.2. Product Offerings
11.6.3. Financial Performance
11.6.4. Recent Initiatives
11.7. Google
11.7.1. Company Overview
11.7.2. Product Offerings
11.7.3. Financial Performance
11.7.4. Recent Initiatives
11.8. Salesforce, Inc.
11.8.1. Company Overview
11.8.2. Product Offerings
11.8.3. Financial Performance
11.8.4. Recent Initiatives
11.9. SAP
11.9.1. Company Overview
11.9.2. Product Offerings
11.9.3. Financial Performance
11.9.4. Recent Initiatives
11.10. SAS Institute, Inc.
11.10.1. Company Overview
11.10.2. Product Offerings
11.10.3. Financial Performance
11.10.4. Recent Initiatives
Chapter 12. Research Methodology
12.1. Primary Research
12.2. Secondary Research
12.3. Assumptions
Chapter 13. Appendix
13.1. About Us
13.2. Glossary of Terms
 Cross-segment Market Size and Analysis for
Mentioned Segments
 Additional Company Profiles (Upto 5 With No Cost)
 Additional Countries (Apart From Mentioned Countries)
 Country/Region-specific Report
 Go To Market Strategy
 Region Specific Market Dynamics
 Region Level Market Share
 Import Export Analysis
 Production Analysis
 Others